Hopi 2 or more Vehicles in Household
COMPARE
Hopi
Select to Compare
2 or more Vehicles in Household
Hopi 2 or more Vehicles in Household
49.0%
2+ VEHICLES AVAILABLE
0.0/ 100
METRIC RATING
307th/ 347
METRIC RANK
Hopi 2 or more Vehicles in Household Correlation Chart
The statistical analysis conducted on geographies consisting of 74,733,485 people shows a substantial negative correlation between the proportion of Hopi and percentage of households with 2 or more vehicles available in the United States with a correlation coefficient (R) of -0.538 and weighted average of 49.0%. On average, for every 1% (one percent) increase in Hopi within a typical geography, there is a decrease of 0.22% in percentage of households with 2 or more vehicles available.
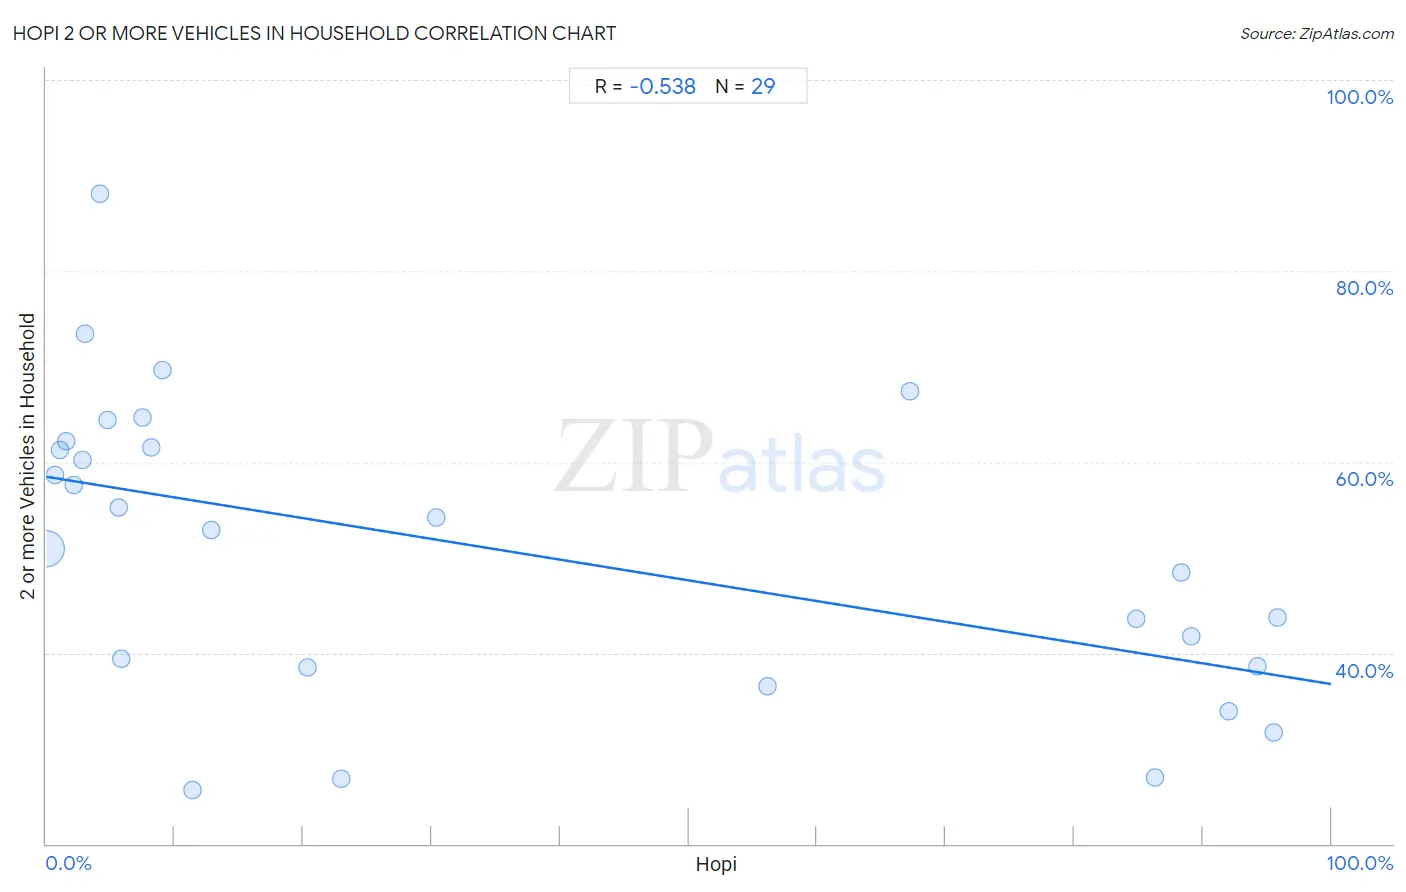
It is essential to understand that the correlation between the percentage of Hopi and percentage of households with 2 or more vehicles available does not imply a direct cause-and-effect relationship. It remains uncertain whether the presence of Hopi influences an upward or downward trend in the level of percentage of households with 2 or more vehicles available within an area, or if Hopi simply ended up residing in those areas with higher or lower levels of percentage of households with 2 or more vehicles available due to other factors.
Demographics Similar to Hopi by 2 or more Vehicles in Household
In terms of 2 or more vehicles in household, the demographic groups most similar to Hopi are Albanian (49.0%, a difference of 0.070%), Moroccan (48.8%, a difference of 0.42%), Immigrants from Israel (49.2%, a difference of 0.43%), Immigrants from Western Africa (49.4%, a difference of 0.69%), and Immigrants from Belize (49.9%, a difference of 1.8%).
| Demographics | Rating | Rank | 2 or more Vehicles in Household |
| Immigrants from Russia | 0.0 /100 | #300 | Tragic 50.3% |
| Immigrants from Greece | 0.0 /100 | #301 | Tragic 50.2% |
| Immigrants from South America | 0.0 /100 | #302 | Tragic 50.2% |
| Tohono O'odham | 0.0 /100 | #303 | Tragic 50.0% |
| Immigrants from Belize | 0.0 /100 | #304 | Tragic 49.9% |
| Immigrants from Western Africa | 0.0 /100 | #305 | Tragic 49.4% |
| Immigrants from Israel | 0.0 /100 | #306 | Tragic 49.2% |
| Hopi | 0.0 /100 | #307 | Tragic 49.0% |
| Albanians | 0.0 /100 | #308 | Tragic 49.0% |
| Moroccans | 0.0 /100 | #309 | Tragic 48.8% |
| Ghanaians | 0.0 /100 | #310 | Tragic 48.0% |
| Immigrants from Belarus | 0.0 /100 | #311 | Tragic 47.9% |
| Haitians | 0.0 /100 | #312 | Tragic 47.6% |
| U.S. Virgin Islanders | 0.0 /100 | #313 | Tragic 47.5% |
| Immigrants from Ghana | 0.0 /100 | #314 | Tragic 47.4% |
Hopi 2 or more Vehicles in Household Correlation Summary
| Measurement | Hopi Data | 2 or more Vehicles in Household Data |
| Minimum | 0.030% | 25.6% |
| Maximum | 95.9% | 88.1% |
| Range | 95.8% | 62.5% |
| Mean | 34.6% | 50.9% |
| Median | 11.4% | 52.9% |
| Interquartile 25% (IQ1) | 3.6% | 38.5% |
| Interquartile 75% (IQ3) | 85.5% | 61.8% |
| Interquartile Range (IQR) | 81.9% | 23.2% |
| Standard Deviation (Sample) | 38.5% | 15.5% |
| Standard Deviation (Population) | 37.8% | 15.3% |
Correlation Details
| Hopi Percentile | Sample Size | 2 or more Vehicles in Household |
[ 0.0% - 0.5% ] 0.030% | 73,932,771 | 50.9% |
[ 0.5% - 1.0% ] 0.66% | 425,102 | 58.6% |
[ 1.0% - 1.5% ] 1.09% | 214,089 | 61.3% |
[ 1.5% - 2.0% ] 1.57% | 55,648 | 62.1% |
[ 2.0% - 2.5% ] 2.09% | 21,914 | 57.5% |
[ 2.5% - 3.0% ] 2.78% | 20,646 | 60.1% |
[ 3.0% - 3.5% ] 3.01% | 7,317 | 73.5% |
[ 4.0% - 4.5% ] 4.19% | 1,478 | 88.1% |
[ 4.5% - 5.0% ] 4.73% | 824 | 64.4% |
[ 5.5% - 6.0% ] 5.61% | 8,887 | 55.3% |
[ 5.5% - 6.0% ] 5.86% | 1,347 | 39.4% |
[ 7.5% - 8.0% ] 7.50% | 6,771 | 64.6% |
[ 8.0% - 8.5% ] 8.22% | 4,842 | 61.5% |
[ 9.0% - 9.5% ] 9.06% | 574 | 69.6% |
[ 11.0% - 11.5% ] 11.37% | 211 | 25.6% |
[ 12.5% - 13.0% ] 12.87% | 11,154 | 52.9% |
[ 20.0% - 20.5% ] 20.32% | 3,918 | 38.5% |
[ 22.5% - 23.0% ] 22.99% | 1,914 | 26.7% |
[ 30.0% - 30.5% ] 30.32% | 343 | 54.2% |
[ 56.0% - 56.5% ] 56.12% | 1,504 | 36.5% |
[ 67.0% - 67.5% ] 67.20% | 436 | 67.4% |
[ 84.5% - 85.0% ] 84.79% | 1,966 | 43.5% |
[ 86.0% - 86.5% ] 86.24% | 1,454 | 26.9% |
[ 88.0% - 88.5% ] 88.35% | 1,064 | 48.4% |
[ 89.0% - 89.5% ] 89.14% | 1,372 | 41.7% |
[ 91.5% - 92.0% ] 91.99% | 2,523 | 33.9% |
[ 94.0% - 94.5% ] 94.25% | 887 | 38.6% |
[ 95.5% - 96.0% ] 95.52% | 1,829 | 31.6% |
[ 95.5% - 96.0% ] 95.86% | 700 | 43.8% |