Hopi Married-couple Households

COMPARE

Hopi
Race
Ancestry
AfghanAfricanAlaska NativeAlaskan AthabascanAlbanianAleutAlsatianAmericanApacheArabArapahoArgentineanArmenianAssyrian/Chaldean/SyriacAustralianAustrianBahamianBangladeshiBarbadianBasqueBelgianBelizeanBermudanBhutaneseBlackfeetBolivianBrazilianBritishBritish West IndianBulgarianBurmeseCajunCambodianCanadianCape VerdeanCarpatho RusynCelticCentral AmericanCentral American IndianCherokeeCheyenneChickasawChileanChineseChippewaChoctawColombianColvilleComancheCosta RicanCreeCreekCroatianCrowCubanCypriotCzechCzechoslovakianDanishDelawareDominicanDutchDutch West IndianEastern EuropeanEcuadorianEgyptianEnglishEstonianEthiopianEuropeanFijianFilipinoFinnishFrenchFrench American IndianFrench CanadianGermanGerman RussianGhanaianGreekGuamanian/ChamorroGuatemalanGuyaneseHaitianHmongHonduranHopiHoumaHungarianIcelanderIndian (Asian)IndonesianInupiatIranianIraqiIrishIroquoisIsraeliItalianJamaicanJapaneseJordanianKenyanKiowaKoreanLaotianLatvianLebaneseLiberianLithuanianLumbeeLuxembourgerMacedonianMalaysianMalteseMarshalleseMenomineeMexicanMexican American IndianMongolianMoroccanNative HawaiianNavajoNepaleseNew ZealanderNicaraguanNigerianNorthern EuropeanNorwegianOkinawanOsageOttawaPaiutePakistaniPalestinianPanamanianParaguayanPennsylvania GermanPeruvianPimaPolishPortuguesePotawatomiPuebloPuerto RicanPuget Sound SalishRomanianRussianSalvadoranSamoanScandinavianScotch-IrishScottishSeminoleSenegaleseSerbianShoshoneSierra LeoneanSiouxSlavicSlovakSloveneSomaliSouth AfricanSouth AmericanSouth American IndianSoviet UnionSpaniardSpanishSpanish AmericanSpanish American IndianSri LankanSubsaharan AfricanSudaneseSwedishSwissSyrianTaiwaneseThaiTlingit-HaidaTohono O'OdhamTonganTrinidadian and TobagonianTsimshianTurkishU.S. Virgin IslanderUgandanUkrainianUruguayanUteVenezuelanVietnameseWelshWest IndianYakamaYaquiYugoslavianYumanYup'ikZimbabwean
Immigration
NonimmigrantsImmigrantsAfghanistanAfricaAlbaniaArgentinaArmeniaAsiaAustraliaAustriaBahamasBangladeshBarbadosBelarusBelgiumBelizeBoliviaBosnia and HerzegovinaBrazilBulgariaBurma/MyanmarCabo VerdeCambodiaCameroonCanadaCaribbeanCentral AmericaChileChinaColombiaCongoCosta RicaCroatiaCubaCzechoslovakiaDenmarkDominicaDominican RepublicEastern AfricaEastern AsiaEastern EuropeEcuadorEgyptEl SalvadorEnglandEritreaEthiopiaEuropeFijiFranceGermanyGhanaGreeceGrenadaGuatemalaGuyanaHaitiHondurasHong KongHungaryIndiaIndonesiaIranIraqIrelandIsraelItalyJamaicaJapanJordanKazakhstanKenyaKoreaKuwaitLaosLatin AmericaLatviaLebanonLiberiaLithuaniaMalaysiaMexicoMicronesiaMiddle AfricaMoldovaMoroccoNepalNetherlandsNicaraguaNigeriaNorth AmericaNorth MacedoniaNorthern AfricaNorthern EuropeNorwayOceaniaPakistanPanamaPeruPhilippinesPolandPortugalRomaniaRussiaSaudi ArabiaScotlandSenegalSerbiaSierra LeoneSingaporeSomaliaSouth AfricaSouth AmericaSouth Central AsiaSouth Eastern AsiaSouthern EuropeSpainSri LankaSt. Vincent and the GrenadinesSudanSwedenSwitzerlandSyriaTaiwanThailandTrinidad and TobagoTurkeyUgandaUkraineUruguayUzbekistanVenezuelaVietnamWest IndiesWestern AfricaWestern AsiaWestern EuropeYemenZaireZimbabweAzores
Select to Compare
Race
Ancestry
AfghanAfricanAlaska NativeAlaskan AthabascanAlbanianAleutAlsatianAmericanApacheArabArapahoArgentineanArmenianAssyrian/Chaldean/SyriacAustralianAustrianBahamianBangladeshiBarbadianBasqueBelgianBelizeanBermudanBhutaneseBlackfeetBolivianBrazilianBritishBritish West IndianBulgarianBurmeseCajunCambodianCanadianCape VerdeanCarpatho RusynCelticCentral AmericanCentral American IndianCherokeeCheyenneChickasawChileanChineseChippewaChoctawColombianColvilleComancheCosta RicanCreeCreekCroatianCrowCubanCypriotCzechCzechoslovakianDanishDelawareDominicanDutchDutch West IndianEastern EuropeanEcuadorianEgyptianEnglishEstonianEthiopianEuropeanFijianFilipinoFinnishFrenchFrench American IndianFrench CanadianGermanGerman RussianGhanaianGreekGuamanian/ChamorroGuatemalanGuyaneseHaitianHmongHonduranHoumaHungarianIcelanderIndian (Asian)IndonesianInupiatIranianIraqiIrishIroquoisIsraeliItalianJamaicanJapaneseJordanianKenyanKiowaKoreanLaotianLatvianLebaneseLiberianLithuanianLumbeeLuxembourgerMacedonianMalaysianMalteseMarshalleseMenomineeMexicanMexican American IndianMongolianMoroccanNative HawaiianNavajoNepaleseNew ZealanderNicaraguanNigerianNorthern EuropeanNorwegianOkinawanOsageOttawaPaiutePakistaniPalestinianPanamanianParaguayanPennsylvania GermanPeruvianPimaPolishPortuguesePotawatomiPuebloPuerto RicanPuget Sound SalishRomanianRussianSalvadoranSamoanScandinavianScotch-IrishScottishSeminoleSenegaleseSerbianShoshoneSierra LeoneanSiouxSlavicSlovakSloveneSomaliSouth AfricanSouth AmericanSouth American IndianSoviet UnionSpaniardSpanishSpanish AmericanSpanish American IndianSri LankanSubsaharan AfricanSudaneseSwedishSwissSyrianTaiwaneseThaiTlingit-HaidaTohono O'OdhamTonganTrinidadian and TobagonianTsimshianTurkishU.S. Virgin IslanderUgandanUkrainianUruguayanUteVenezuelanVietnameseWelshWest IndianYakamaYaquiYugoslavianYumanYup'ikZimbabwean
Immigration
NonimmigrantsImmigrantsAfghanistanAfricaAlbaniaArgentinaArmeniaAsiaAustraliaAustriaBahamasBangladeshBarbadosBelarusBelgiumBelizeBoliviaBosnia and HerzegovinaBrazilBulgariaBurma/MyanmarCabo VerdeCambodiaCameroonCanadaCaribbeanCentral AmericaChileChinaColombiaCongoCosta RicaCroatiaCubaCzechoslovakiaDenmarkDominicaDominican RepublicEastern AfricaEastern AsiaEastern EuropeEcuadorEgyptEl SalvadorEnglandEritreaEthiopiaEuropeFijiFranceGermanyGhanaGreeceGrenadaGuatemalaGuyanaHaitiHondurasHong KongHungaryIndiaIndonesiaIranIraqIrelandIsraelItalyJamaicaJapanJordanKazakhstanKenyaKoreaKuwaitLaosLatin AmericaLatviaLebanonLiberiaLithuaniaMalaysiaMexicoMicronesiaMiddle AfricaMoldovaMoroccoNepalNetherlandsNicaraguaNigeriaNorth AmericaNorth MacedoniaNorthern AfricaNorthern EuropeNorwayOceaniaPakistanPanamaPeruPhilippinesPolandPortugalRomaniaRussiaSaudi ArabiaScotlandSenegalSerbiaSierra LeoneSingaporeSomaliaSouth AfricaSouth AmericaSouth Central AsiaSouth Eastern AsiaSouthern EuropeSpainSri LankaSt. Vincent and the GrenadinesSudanSwedenSwitzerlandSyriaTaiwanThailandTrinidad and TobagoTurkeyUgandaUkraineUruguayUzbekistanVenezuelaVietnamWest IndiesWestern AfricaWestern AsiaWestern EuropeYemenZaireZimbabweAzores
Married-couple Households
Income
Poverty
Unemployment
Labor Participation
Family Structure
Vehicle Availability
Education Level
Disability

Hopi Married-couple Households
Tragic

36.7%
MARRIED-COUPLE HOUSEHOLDS
0.0/ 100
METRIC RATING
345th/ 347
METRIC RANK

Hopi Married-couple Households Correlation Chart

The statistical analysis conducted on geographies consisting of 74,731,609 people shows a substantial negative correlation between the proportion of Hopi and percentage of married-couple family households in the United States with a correlation coefficient (R) of -0.506 and weighted average of 36.7%. On average, for every 1% (one percent) increase in Hopi within a typical geography, there is a decrease of 0.14% in percentage of married-couple family households.
Hopi Married-couple Households
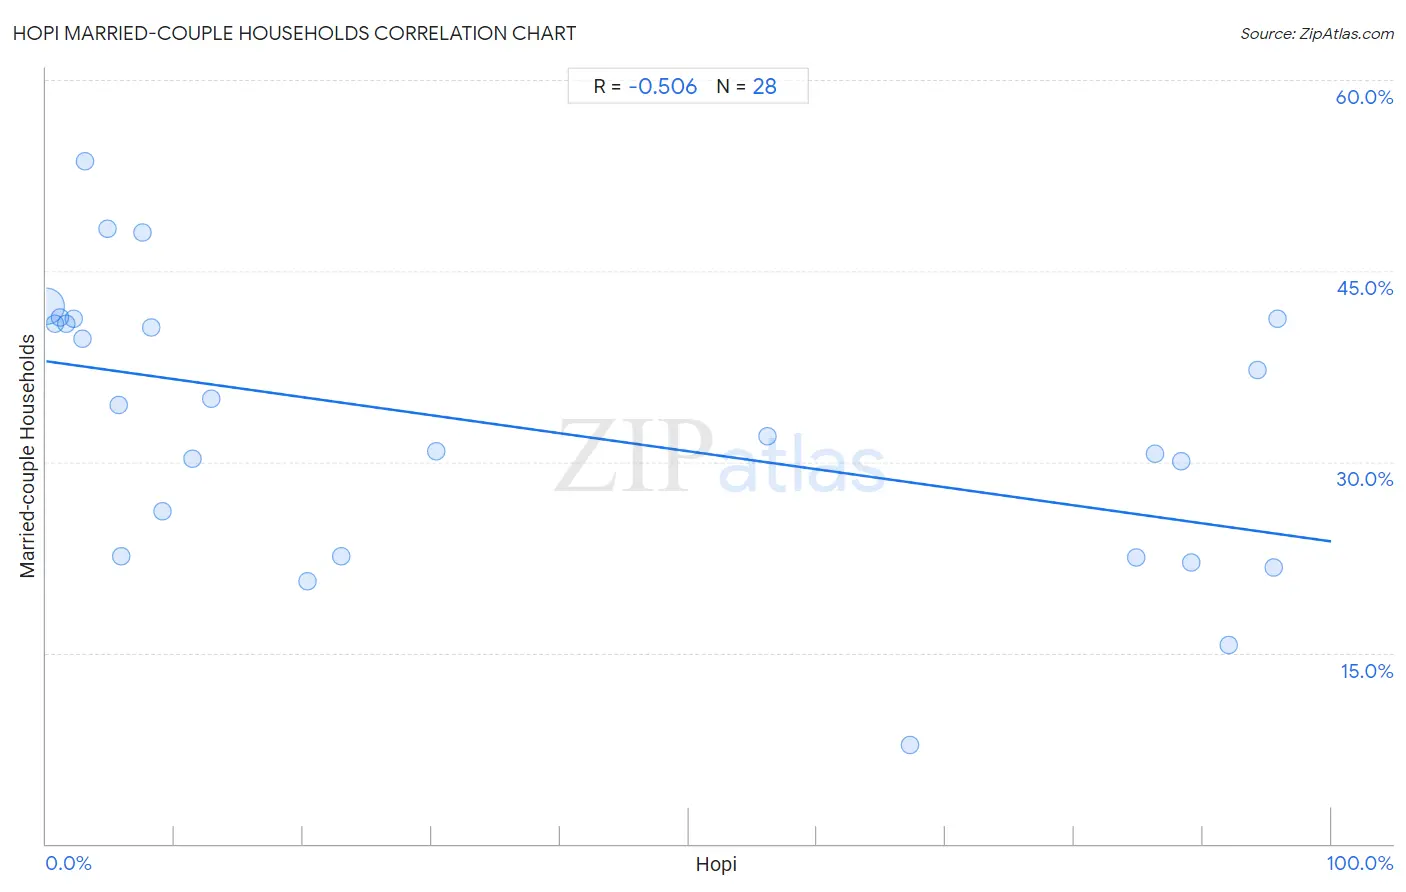
It is essential to understand that the correlation between the percentage of Hopi and percentage of married-couple family households does not imply a direct cause-and-effect relationship. It remains uncertain whether the presence of Hopi influences an upward or downward trend in the level of percentage of married-couple family households within an area, or if Hopi simply ended up residing in those areas with higher or lower levels of percentage of married-couple family households due to other factors.

Demographics Similar to Hopi by Married-couple Households

In terms of married-couple households, the demographic groups most similar to Hopi are Immigrants from Cabo Verde (36.2%, a difference of 1.2%), Immigrants from Dominican Republic (37.3%, a difference of 1.8%), Immigrants from Grenada (37.5%, a difference of 2.2%), Pima (35.6%, a difference of 3.2%), and Tohono O'odham (37.9%, a difference of 3.3%).
DemographicsRating | RankMarried-couple Households
Immigrants from West Indies
0.0
/100
|
#333
Tragic
39.0%
Immigrants from St. Vincent and the Grenadines
0.0
/100
|
#334
Tragic
38.7%
Senegalese
0.0
/100
|
#335
Tragic
38.6%
Blacks/African Americans
0.0
/100
|
#336
Tragic
38.5%
Immigrants from Somalia
0.0
/100
|
#337
Tragic
38.4%
Immigrants from Senegal
0.0
/100
|
#338
Tragic
38.4%
British West Indians
0.0
/100
|
#339
Tragic
38.3%
Dominicans
0.0
/100
|
#340
Tragic
38.2%
Cape Verdeans
0.0
/100
|
#341
Tragic
38.1%
Tohono O'odham
0.0
/100
|
#342
Tragic
37.9%
Immigrants from Grenada
0.0
/100
|
#343
Tragic
37.5%
Immigrants from Dominican Republic
0.0
/100
|
#344
Tragic
37.3%
Hopi
0.0
/100
|
#345
Tragic
36.7%
Immigrants from Cabo Verde
0.0
/100
|
#346
Tragic
36.2%
Pima
0.0
/100
|
#347
Tragic
35.6%

Hopi Married-couple Households Correlation Summary

MeasurementHopi DataMarried-couple Households Data
Minimum0.030%7.8%
Maximum95.9%53.7%
Range95.8%45.9%
Mean35.7%32.9%
Median12.1%33.2%
Interquartile 25% (IQ1)3.9%22.6%
Interquartile 75% (IQ3)85.5%41.0%
Interquartile Range (IQR)81.6%18.4%
Standard Deviation (Sample)38.7%10.8%
Standard Deviation (Population)38.0%10.6%

Correlation Details

Hopi PercentileSample SizeMarried-couple Households
[
0.0%
-
0.5%
]
0.030%
73,932,77142.3%
[
0.5%
-
1.0%
]
0.66%
425,10240.8%
[
1.0%
-
1.5%
]
1.09%
214,08941.3%
[
1.5%
-
2.0%
]
1.57%
55,64840.9%
[
2.0%
-
2.5%
]
2.09%
21,91441.2%
[
2.5%
-
3.0%
]
2.78%
20,64639.7%
[
3.0%
-
3.5%
]
3.01%
6,91953.7%
[
4.5%
-
5.0%
]
4.73%
82448.3%
[
5.5%
-
6.0%
]
5.61%
8,88734.4%
[
5.5%
-
6.0%
]
5.86%
1,34722.6%
[
7.5%
-
8.0%
]
7.50%
6,77148.0%
[
8.0%
-
8.5%
]
8.22%
4,84240.6%
[
9.0%
-
9.5%
]
9.06%
57426.1%
[
11.0%
-
11.5%
]
11.37%
21130.2%
[
12.5%
-
13.0%
]
12.87%
11,15434.9%
[
20.0%
-
20.5%
]
20.32%
3,91820.7%
[
22.5%
-
23.0%
]
22.99%
1,91422.6%
[
30.0%
-
30.5%
]
30.32%
34330.8%
[
56.0%
-
56.5%
]
56.12%
1,50432.0%
[
67.0%
-
67.5%
]
67.20%
4367.8%
[
84.5%
-
85.0%
]
84.79%
1,96622.5%
[
86.0%
-
86.5%
]
86.24%
1,45430.7%
[
88.0%
-
88.5%
]
88.35%
1,06430.0%
[
89.0%
-
89.5%
]
89.14%
1,37222.1%
[
91.5%
-
92.0%
]
91.99%
2,52315.6%
[
94.0%
-
94.5%
]
94.25%
88737.2%
[
95.5%
-
96.0%
]
95.52%
1,82921.7%
[
95.5%
-
96.0%
]
95.86%
70041.2%