Hopi GED/Equivalency
COMPARE
Hopi
Select to Compare
GED/Equivalency
Hopi GED/Equivalency
83.0%
GED/EQUIVALENCY
0.2/ 100
METRIC RATING
269th/ 347
METRIC RANK
Hopi GED/Equivalency Correlation Chart
The statistical analysis conducted on geographies consisting of 74,739,957 people shows no correlation between the proportion of Hopi and percentage of population with at least ged/equivalency education in the United States with a correlation coefficient (R) of -0.045 and weighted average of 83.0%. On average, for every 1% (one percent) increase in Hopi within a typical geography, there is a decrease of 0.0064% in percentage of population with at least ged/equivalency education.
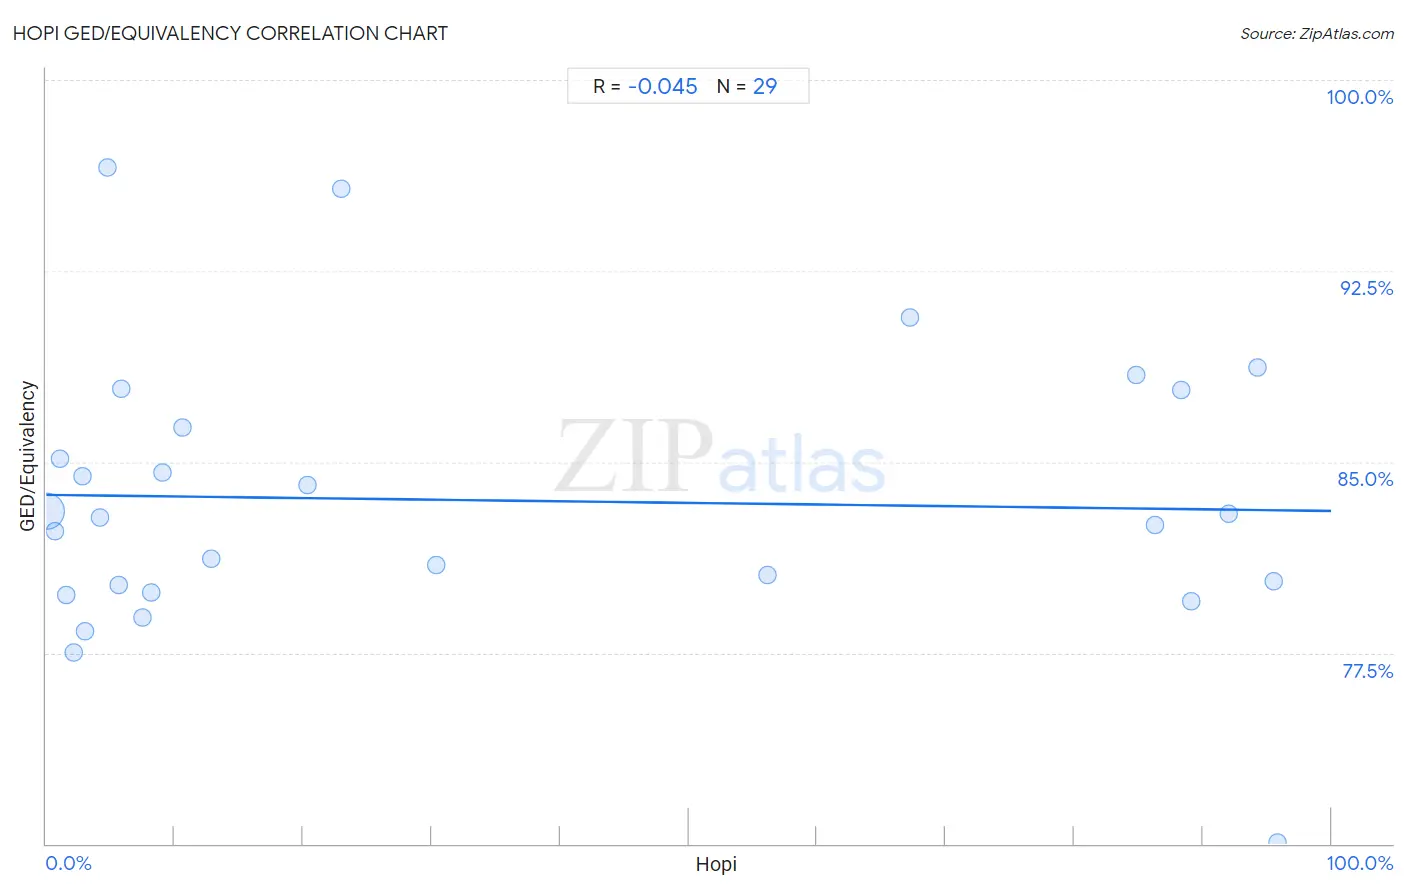
It is essential to understand that the correlation between the percentage of Hopi and percentage of population with at least ged/equivalency education does not imply a direct cause-and-effect relationship. It remains uncertain whether the presence of Hopi influences an upward or downward trend in the level of percentage of population with at least ged/equivalency education within an area, or if Hopi simply ended up residing in those areas with higher or lower levels of percentage of population with at least ged/equivalency education due to other factors.
Demographics Similar to Hopi by GED/Equivalency
In terms of ged/equivalency, the demographic groups most similar to Hopi are Immigrants from Burma/Myanmar (83.0%, a difference of 0.040%), Immigrants from Jamaica (82.9%, a difference of 0.050%), Trinidadian and Tobagonian (83.0%, a difference of 0.080%), U.S. Virgin Islander (82.9%, a difference of 0.090%), and Kiowa (83.1%, a difference of 0.10%).
| Demographics | Rating | Rank | GED/Equivalency |
| Immigrants from Armenia | 0.2 /100 | #262 | Tragic 83.1% |
| Immigrants from Congo | 0.2 /100 | #263 | Tragic 83.1% |
| Bangladeshis | 0.2 /100 | #264 | Tragic 83.1% |
| West Indians | 0.2 /100 | #265 | Tragic 83.1% |
| Kiowa | 0.2 /100 | #266 | Tragic 83.1% |
| Trinidadians and Tobagonians | 0.2 /100 | #267 | Tragic 83.0% |
| Immigrants from Burma/Myanmar | 0.2 /100 | #268 | Tragic 83.0% |
| Hopi | 0.2 /100 | #269 | Tragic 83.0% |
| Immigrants from Jamaica | 0.2 /100 | #270 | Tragic 82.9% |
| U.S. Virgin Islanders | 0.2 /100 | #271 | Tragic 82.9% |
| Barbadians | 0.1 /100 | #272 | Tragic 82.9% |
| Pennsylvania Germans | 0.1 /100 | #273 | Tragic 82.9% |
| Immigrants from Trinidad and Tobago | 0.1 /100 | #274 | Tragic 82.8% |
| Seminole | 0.1 /100 | #275 | Tragic 82.8% |
| Blacks/African Americans | 0.1 /100 | #276 | Tragic 82.8% |
Hopi GED/Equivalency Correlation Summary
| Measurement | Hopi Data | GED/Equivalency Data |
| Minimum | 0.030% | 70.0% |
| Maximum | 95.9% | 96.6% |
| Range | 95.8% | 26.5% |
| Mean | 34.6% | 83.5% |
| Median | 10.6% | 82.8% |
| Interquartile 25% (IQ1) | 3.6% | 80.0% |
| Interquartile 75% (IQ3) | 85.5% | 87.1% |
| Interquartile Range (IQR) | 81.9% | 7.1% |
| Standard Deviation (Sample) | 38.5% | 5.4% |
| Standard Deviation (Population) | 37.8% | 5.3% |
Correlation Details
| Hopi Percentile | Sample Size | GED/Equivalency |
[ 0.0% - 0.5% ] 0.030% | 73,938,146 | 83.1% |
[ 0.5% - 1.0% ] 0.66% | 426,363 | 82.3% |
[ 1.0% - 1.5% ] 1.09% | 214,089 | 85.1% |
[ 1.5% - 2.0% ] 1.57% | 55,648 | 79.7% |
[ 2.0% - 2.5% ] 2.09% | 21,914 | 77.5% |
[ 2.5% - 3.0% ] 2.78% | 20,646 | 84.4% |
[ 3.0% - 3.5% ] 3.01% | 7,317 | 78.4% |
[ 4.0% - 4.5% ] 4.19% | 1,478 | 82.8% |
[ 4.5% - 5.0% ] 4.73% | 824 | 96.6% |
[ 5.5% - 6.0% ] 5.61% | 8,887 | 80.1% |
[ 5.5% - 6.0% ] 5.86% | 1,347 | 87.9% |
[ 7.5% - 8.0% ] 7.50% | 6,771 | 78.9% |
[ 8.0% - 8.5% ] 8.22% | 4,842 | 79.9% |
[ 9.0% - 9.5% ] 9.06% | 574 | 84.6% |
[ 10.5% - 11.0% ] 10.64% | 47 | 86.4% |
[ 12.5% - 13.0% ] 12.87% | 11,154 | 81.2% |
[ 20.0% - 20.5% ] 20.32% | 3,918 | 84.1% |
[ 22.5% - 23.0% ] 22.99% | 1,914 | 95.7% |
[ 30.0% - 30.5% ] 30.32% | 343 | 80.9% |
[ 56.0% - 56.5% ] 56.12% | 1,504 | 80.6% |
[ 67.0% - 67.5% ] 67.20% | 436 | 90.7% |
[ 84.5% - 85.0% ] 84.79% | 1,966 | 88.4% |
[ 86.0% - 86.5% ] 86.24% | 1,454 | 82.5% |
[ 88.0% - 88.5% ] 88.35% | 1,064 | 87.8% |
[ 89.0% - 89.5% ] 89.14% | 1,372 | 79.5% |
[ 91.5% - 92.0% ] 91.99% | 2,523 | 82.9% |
[ 94.0% - 94.5% ] 94.25% | 887 | 88.7% |
[ 95.5% - 96.0% ] 95.52% | 1,829 | 80.3% |
[ 95.5% - 96.0% ] 95.86% | 700 | 70.0% |