Hopi College, 1 year or more

COMPARE

Hopi
Race
Ancestry
AfghanAfricanAlaska NativeAlaskan AthabascanAlbanianAleutAlsatianAmericanApacheArabArapahoArgentineanArmenianAssyrian/Chaldean/SyriacAustralianAustrianBahamianBangladeshiBarbadianBasqueBelgianBelizeanBermudanBhutaneseBlackfeetBolivianBrazilianBritishBritish West IndianBulgarianBurmeseCajunCambodianCanadianCape VerdeanCarpatho RusynCelticCentral AmericanCentral American IndianCherokeeCheyenneChickasawChileanChineseChippewaChoctawColombianColvilleComancheCosta RicanCreeCreekCroatianCrowCubanCypriotCzechCzechoslovakianDanishDelawareDominicanDutchDutch West IndianEastern EuropeanEcuadorianEgyptianEnglishEstonianEthiopianEuropeanFijianFilipinoFinnishFrenchFrench American IndianFrench CanadianGermanGerman RussianGhanaianGreekGuamanian/ChamorroGuatemalanGuyaneseHaitianHmongHonduranHopiHoumaHungarianIcelanderIndian (Asian)IndonesianInupiatIranianIraqiIrishIroquoisIsraeliItalianJamaicanJapaneseJordanianKenyanKiowaKoreanLaotianLatvianLebaneseLiberianLithuanianLumbeeLuxembourgerMacedonianMalaysianMalteseMarshalleseMenomineeMexicanMexican American IndianMongolianMoroccanNative HawaiianNavajoNepaleseNew ZealanderNicaraguanNigerianNorthern EuropeanNorwegianOkinawanOsageOttawaPaiutePakistaniPalestinianPanamanianParaguayanPennsylvania GermanPeruvianPimaPolishPortuguesePotawatomiPuebloPuerto RicanPuget Sound SalishRomanianRussianSalvadoranSamoanScandinavianScotch-IrishScottishSeminoleSenegaleseSerbianShoshoneSierra LeoneanSiouxSlavicSlovakSloveneSomaliSouth AfricanSouth AmericanSouth American IndianSoviet UnionSpaniardSpanishSpanish AmericanSpanish American IndianSri LankanSubsaharan AfricanSudaneseSwedishSwissSyrianTaiwaneseThaiTlingit-HaidaTohono O'OdhamTonganTrinidadian and TobagonianTsimshianTurkishU.S. Virgin IslanderUgandanUkrainianUruguayanUteVenezuelanVietnameseWelshWest IndianYakamaYaquiYugoslavianYumanYup'ikZimbabwean
Immigration
NonimmigrantsImmigrantsAfghanistanAfricaAlbaniaArgentinaArmeniaAsiaAustraliaAustriaBahamasBangladeshBarbadosBelarusBelgiumBelizeBoliviaBosnia and HerzegovinaBrazilBulgariaBurma/MyanmarCabo VerdeCambodiaCameroonCanadaCaribbeanCentral AmericaChileChinaColombiaCongoCosta RicaCroatiaCubaCzechoslovakiaDenmarkDominicaDominican RepublicEastern AfricaEastern AsiaEastern EuropeEcuadorEgyptEl SalvadorEnglandEritreaEthiopiaEuropeFijiFranceGermanyGhanaGreeceGrenadaGuatemalaGuyanaHaitiHondurasHong KongHungaryIndiaIndonesiaIranIraqIrelandIsraelItalyJamaicaJapanJordanKazakhstanKenyaKoreaKuwaitLaosLatin AmericaLatviaLebanonLiberiaLithuaniaMalaysiaMexicoMicronesiaMiddle AfricaMoldovaMoroccoNepalNetherlandsNicaraguaNigeriaNorth AmericaNorth MacedoniaNorthern AfricaNorthern EuropeNorwayOceaniaPakistanPanamaPeruPhilippinesPolandPortugalRomaniaRussiaSaudi ArabiaScotlandSenegalSerbiaSierra LeoneSingaporeSomaliaSouth AfricaSouth AmericaSouth Central AsiaSouth Eastern AsiaSouthern EuropeSpainSri LankaSt. Vincent and the GrenadinesSudanSwedenSwitzerlandSyriaTaiwanThailandTrinidad and TobagoTurkeyUgandaUkraineUruguayUzbekistanVenezuelaVietnamWest IndiesWestern AfricaWestern AsiaWestern EuropeYemenZaireZimbabweAzores
Select to Compare
Race
Ancestry
AfghanAfricanAlaska NativeAlaskan AthabascanAlbanianAleutAlsatianAmericanApacheArabArapahoArgentineanArmenianAssyrian/Chaldean/SyriacAustralianAustrianBahamianBangladeshiBarbadianBasqueBelgianBelizeanBermudanBhutaneseBlackfeetBolivianBrazilianBritishBritish West IndianBulgarianBurmeseCajunCambodianCanadianCape VerdeanCarpatho RusynCelticCentral AmericanCentral American IndianCherokeeCheyenneChickasawChileanChineseChippewaChoctawColombianColvilleComancheCosta RicanCreeCreekCroatianCrowCubanCypriotCzechCzechoslovakianDanishDelawareDominicanDutchDutch West IndianEastern EuropeanEcuadorianEgyptianEnglishEstonianEthiopianEuropeanFijianFilipinoFinnishFrenchFrench American IndianFrench CanadianGermanGerman RussianGhanaianGreekGuamanian/ChamorroGuatemalanGuyaneseHaitianHmongHonduranHoumaHungarianIcelanderIndian (Asian)IndonesianInupiatIranianIraqiIrishIroquoisIsraeliItalianJamaicanJapaneseJordanianKenyanKiowaKoreanLaotianLatvianLebaneseLiberianLithuanianLumbeeLuxembourgerMacedonianMalaysianMalteseMarshalleseMenomineeMexicanMexican American IndianMongolianMoroccanNative HawaiianNavajoNepaleseNew ZealanderNicaraguanNigerianNorthern EuropeanNorwegianOkinawanOsageOttawaPaiutePakistaniPalestinianPanamanianParaguayanPennsylvania GermanPeruvianPimaPolishPortuguesePotawatomiPuebloPuerto RicanPuget Sound SalishRomanianRussianSalvadoranSamoanScandinavianScotch-IrishScottishSeminoleSenegaleseSerbianShoshoneSierra LeoneanSiouxSlavicSlovakSloveneSomaliSouth AfricanSouth AmericanSouth American IndianSoviet UnionSpaniardSpanishSpanish AmericanSpanish American IndianSri LankanSubsaharan AfricanSudaneseSwedishSwissSyrianTaiwaneseThaiTlingit-HaidaTohono O'OdhamTonganTrinidadian and TobagonianTsimshianTurkishU.S. Virgin IslanderUgandanUkrainianUruguayanUteVenezuelanVietnameseWelshWest IndianYakamaYaquiYugoslavianYumanYup'ikZimbabwean
Immigration
NonimmigrantsImmigrantsAfghanistanAfricaAlbaniaArgentinaArmeniaAsiaAustraliaAustriaBahamasBangladeshBarbadosBelarusBelgiumBelizeBoliviaBosnia and HerzegovinaBrazilBulgariaBurma/MyanmarCabo VerdeCambodiaCameroonCanadaCaribbeanCentral AmericaChileChinaColombiaCongoCosta RicaCroatiaCubaCzechoslovakiaDenmarkDominicaDominican RepublicEastern AfricaEastern AsiaEastern EuropeEcuadorEgyptEl SalvadorEnglandEritreaEthiopiaEuropeFijiFranceGermanyGhanaGreeceGrenadaGuatemalaGuyanaHaitiHondurasHong KongHungaryIndiaIndonesiaIranIraqIrelandIsraelItalyJamaicaJapanJordanKazakhstanKenyaKoreaKuwaitLaosLatin AmericaLatviaLebanonLiberiaLithuaniaMalaysiaMexicoMicronesiaMiddle AfricaMoldovaMoroccoNepalNetherlandsNicaraguaNigeriaNorth AmericaNorth MacedoniaNorthern AfricaNorthern EuropeNorwayOceaniaPakistanPanamaPeruPhilippinesPolandPortugalRomaniaRussiaSaudi ArabiaScotlandSenegalSerbiaSierra LeoneSingaporeSomaliaSouth AfricaSouth AmericaSouth Central AsiaSouth Eastern AsiaSouthern EuropeSpainSri LankaSt. Vincent and the GrenadinesSudanSwedenSwitzerlandSyriaTaiwanThailandTrinidad and TobagoTurkeyUgandaUkraineUruguayUzbekistanVenezuelaVietnamWest IndiesWestern AfricaWestern AsiaWestern EuropeYemenZaireZimbabweAzores
College, 1 year or more
Income
Poverty
Unemployment
Labor Participation
Family Structure
Vehicle Availability
Education Level
Disability

Hopi College, 1 year or more
Tragic

50.9%
COLLEGE, 1 YEAR OR MORE
0.0/ 100
METRIC RATING
321st/ 347
METRIC RANK

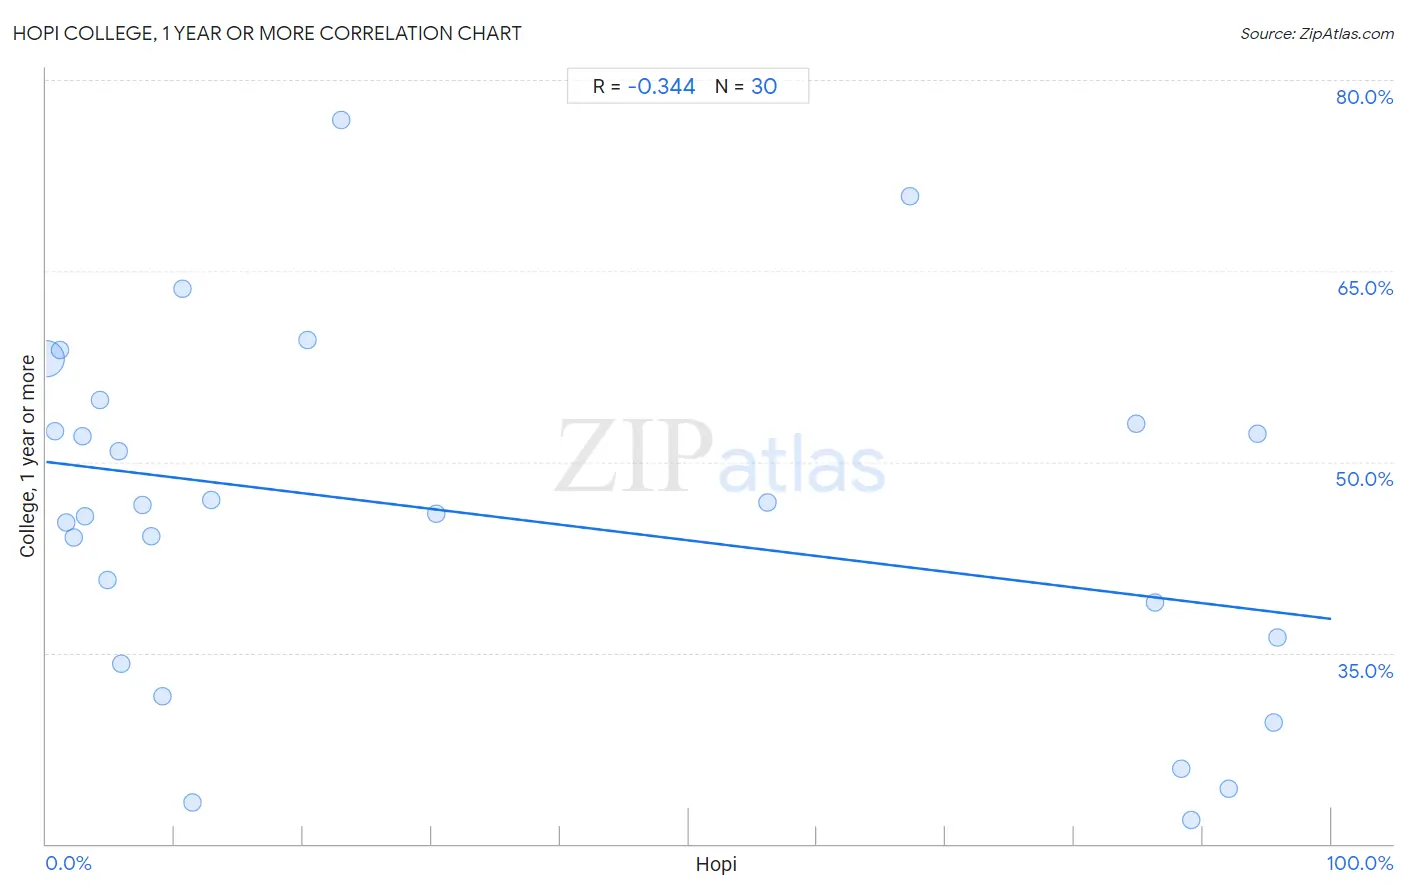
Hopi College, 1 year or more Correlation Chart

The statistical analysis conducted on geographies consisting of 74,740,168 people shows a mild negative correlation between the proportion of Hopi and percentage of population with at least college, 1 year or more education in the United States with a correlation coefficient (R) of -0.344 and weighted average of 50.9%. On average, for every 1% (one percent) increase in Hopi within a typical geography, there is a decrease of 0.12% in percentage of population with at least college, 1 year or more education.
Hopi College, 1 year or more
It is essential to understand that the correlation between the percentage of Hopi and percentage of population with at least college, 1 year or more education does not imply a direct cause-and-effect relationship. It remains uncertain whether the presence of Hopi influences an upward or downward trend in the level of percentage of population with at least college, 1 year or more education within an area, or if Hopi simply ended up residing in those areas with higher or lower levels of percentage of population with at least college, 1 year or more education due to other factors.

Demographics Similar to Hopi by College, 1 year or more

In terms of college, 1 year or more, the demographic groups most similar to Hopi are Kiowa (51.0%, a difference of 0.12%), Navajo (50.8%, a difference of 0.18%), Immigrants from El Salvador (51.0%, a difference of 0.19%), Immigrants from Honduras (51.0%, a difference of 0.27%), and Hispanic or Latino (51.1%, a difference of 0.40%).
DemographicsRating | RankCollege, 1 year or more
Fijians
0.0
/100
|
#314
Tragic
51.3%
Guatemalans
0.0
/100
|
#315
Tragic
51.2%
Cajuns
0.0
/100
|
#316
Tragic
51.2%
Hispanics or Latinos
0.0
/100
|
#317
Tragic
51.1%
Immigrants from Honduras
0.0
/100
|
#318
Tragic
51.0%
Immigrants from El Salvador
0.0
/100
|
#319
Tragic
51.0%
Kiowa
0.0
/100
|
#320
Tragic
51.0%
Hopi
0.0
/100
|
#321
Tragic
50.9%
Navajo
0.0
/100
|
#322
Tragic
50.8%
Immigrants from Guatemala
0.0
/100
|
#323
Tragic
50.7%
Immigrants from Cuba
0.0
/100
|
#324
Tragic
50.7%
Immigrants from Latin America
0.0
/100
|
#325
Tragic
50.7%
Dominicans
0.0
/100
|
#326
Tragic
50.6%
Menominee
0.0
/100
|
#327
Tragic
50.6%
Dutch West Indians
0.0
/100
|
#328
Tragic
50.5%

Hopi College, 1 year or more Correlation Summary

MeasurementHopi DataCollege, 1 year or more Data
Minimum0.030%21.9%
Maximum95.9%76.9%
Range95.8%55.0%
Mean33.8%45.8%
Median11.0%46.2%
Interquartile 25% (IQ1)4.2%36.2%
Interquartile 75% (IQ3)84.8%53.0%
Interquartile Range (IQR)80.6%16.9%
Standard Deviation (Sample)38.1%13.7%
Standard Deviation (Population)37.4%13.4%

Correlation Details

Hopi PercentileSample SizeCollege, 1 year or more
[
0.0%
-
0.5%
]
0.030%
73,938,14658.1%
[
0.5%
-
1.0%
]
0.66%
426,36352.4%
[
1.0%
-
1.5%
]
1.09%
214,08958.7%
[
1.5%
-
2.0%
]
1.57%
55,64845.2%
[
2.0%
-
2.5%
]
2.09%
21,91444.0%
[
2.5%
-
3.0%
]
2.78%
20,64652.0%
[
3.0%
-
3.5%
]
3.01%
7,31745.7%
[
4.0%
-
4.5%
]
4.19%
1,47854.9%
[
4.5%
-
5.0%
]
4.73%
82440.7%
[
5.5%
-
6.0%
]
5.61%
8,88750.9%
[
5.5%
-
6.0%
]
5.86%
1,34734.1%
[
7.5%
-
8.0%
]
7.50%
6,77146.6%
[
8.0%
-
8.5%
]
8.22%
4,84244.1%
[
9.0%
-
9.5%
]
9.06%
57431.6%
[
10.5%
-
11.0%
]
10.64%
4763.6%
[
11.0%
-
11.5%
]
11.37%
21123.2%
[
12.5%
-
13.0%
]
12.87%
11,15447.0%
[
20.0%
-
20.5%
]
20.32%
3,91859.5%
[
22.5%
-
23.0%
]
22.99%
1,91476.9%
[
30.0%
-
30.5%
]
30.32%
34345.9%
[
56.0%
-
56.5%
]
56.12%
1,50446.8%
[
67.0%
-
67.5%
]
67.20%
43670.8%
[
84.5%
-
85.0%
]
84.79%
1,96653.0%
[
86.0%
-
86.5%
]
86.24%
1,45439.0%
[
88.0%
-
88.5%
]
88.35%
1,06425.9%
[
89.0%
-
89.5%
]
89.14%
1,37221.9%
[
91.5%
-
92.0%
]
91.99%
2,52324.3%
[
94.0%
-
94.5%
]
94.25%
88752.3%
[
95.5%
-
96.0%
]
95.52%
1,82929.5%
[
95.5%
-
96.0%
]
95.86%
70036.2%