Hopi 4 or more Vehicles in Household
COMPARE
Hopi
Select to Compare
4 or more Vehicles in Household
Hopi 4 or more Vehicles in Household
6.9%
4+ VEHICLES AVAILABLE
97.0/ 100
METRIC RATING
112th/ 347
METRIC RANK
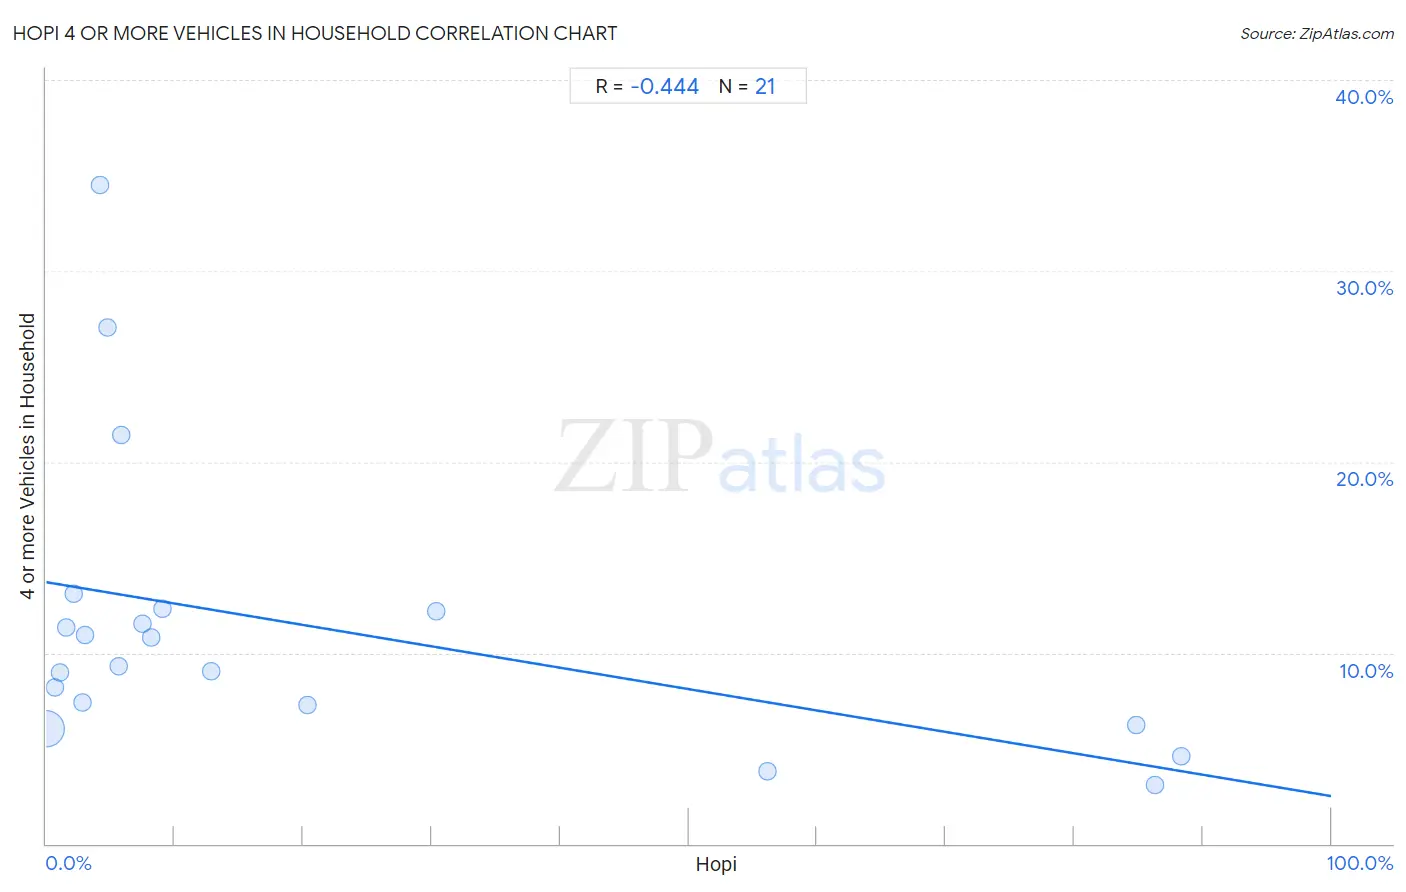
Hopi 4 or more Vehicles in Household Correlation Chart
The statistical analysis conducted on geographies consisting of 74,704,966 people shows a moderate negative correlation between the proportion of Hopi and percentage of households with 4 or more vehicles available in the United States with a correlation coefficient (R) of -0.444 and weighted average of 6.9%. On average, for every 1% (one percent) increase in Hopi within a typical geography, there is a decrease of 0.11% in percentage of households with 4 or more vehicles available.
It is essential to understand that the correlation between the percentage of Hopi and percentage of households with 4 or more vehicles available does not imply a direct cause-and-effect relationship. It remains uncertain whether the presence of Hopi influences an upward or downward trend in the level of percentage of households with 4 or more vehicles available within an area, or if Hopi simply ended up residing in those areas with higher or lower levels of percentage of households with 4 or more vehicles available due to other factors.
Demographics Similar to Hopi by 4 or more Vehicles in Household
In terms of 4 or more vehicles in household, the demographic groups most similar to Hopi are Aleut (6.9%, a difference of 0.010%), Immigrants from Thailand (6.9%, a difference of 0.030%), Canadian (6.9%, a difference of 0.42%), Bolivian (6.8%, a difference of 0.47%), and Tlingit-Haida (6.8%, a difference of 0.53%).
| Demographics | Rating | Rank | 4 or more Vehicles in Household |
| German Russians | 98.3 /100 | #105 | Exceptional 7.0% |
| Guatemalans | 98.1 /100 | #106 | Exceptional 7.0% |
| Nicaraguans | 98.0 /100 | #107 | Exceptional 7.0% |
| French | 97.7 /100 | #108 | Exceptional 6.9% |
| Filipinos | 97.6 /100 | #109 | Exceptional 6.9% |
| Immigrants from Thailand | 97.0 /100 | #110 | Exceptional 6.9% |
| Aleuts | 97.0 /100 | #111 | Exceptional 6.9% |
| Hopi | 97.0 /100 | #112 | Exceptional 6.9% |
| Canadians | 96.4 /100 | #113 | Exceptional 6.9% |
| Bolivians | 96.3 /100 | #114 | Exceptional 6.8% |
| Tlingit-Haida | 96.2 /100 | #115 | Exceptional 6.8% |
| Immigrants from Guatemala | 95.8 /100 | #116 | Exceptional 6.8% |
| Burmese | 95.7 /100 | #117 | Exceptional 6.8% |
| French American Indians | 95.7 /100 | #118 | Exceptional 6.8% |
| Costa Ricans | 95.5 /100 | #119 | Exceptional 6.8% |
Hopi 4 or more Vehicles in Household Correlation Summary
| Measurement | Hopi Data | 4 or more Vehicles in Household Data |
| Minimum | 0.030% | 3.0% |
| Maximum | 88.3% | 34.5% |
| Range | 88.3% | 31.5% |
| Mean | 20.7% | 11.4% |
| Median | 5.9% | 9.3% |
| Interquartile 25% (IQ1) | 2.4% | 6.8% |
| Interquartile 75% (IQ3) | 25.3% | 12.2% |
| Interquartile Range (IQR) | 22.9% | 5.5% |
| Standard Deviation (Sample) | 30.3% | 7.7% |
| Standard Deviation (Population) | 29.6% | 7.5% |
Correlation Details
| Hopi Percentile | Sample Size | 4 or more Vehicles in Household |
[ 0.0% - 0.5% ] 0.030% | 73,922,502 | 6.0% |
[ 0.5% - 1.0% ] 0.66% | 422,883 | 8.2% |
[ 1.0% - 1.5% ] 1.08% | 210,635 | 9.0% |
[ 1.5% - 2.0% ] 1.57% | 55,648 | 11.3% |
[ 2.0% - 2.5% ] 2.09% | 21,914 | 13.1% |
[ 2.5% - 3.0% ] 2.78% | 20,646 | 7.4% |
[ 3.0% - 3.5% ] 3.01% | 7,317 | 11.0% |
[ 4.0% - 4.5% ] 4.19% | 1,478 | 34.5% |
[ 4.5% - 5.0% ] 4.73% | 824 | 27.0% |
[ 5.5% - 6.0% ] 5.61% | 8,887 | 9.3% |
[ 5.5% - 6.0% ] 5.86% | 1,347 | 21.4% |
[ 7.0% - 7.5% ] 7.50% | 6,377 | 11.5% |
[ 8.0% - 8.5% ] 8.22% | 4,842 | 10.8% |
[ 9.0% - 9.5% ] 9.06% | 574 | 12.3% |
[ 12.5% - 13.0% ] 12.87% | 11,154 | 9.0% |
[ 20.0% - 20.5% ] 20.29% | 1,607 | 7.3% |
[ 30.0% - 30.5% ] 30.32% | 343 | 12.1% |
[ 56.0% - 56.5% ] 56.12% | 1,504 | 3.8% |
[ 84.5% - 85.0% ] 84.79% | 1,966 | 6.2% |
[ 86.0% - 86.5% ] 86.24% | 1,454 | 3.0% |
[ 88.0% - 88.5% ] 88.35% | 1,064 | 4.6% |