Haitian 5th Grade
COMPARE
Haitian
Select to Compare
5th Grade
Haitian 5th Grade
96.3%
5TH GRADE
0.0/ 100
METRIC RATING
297th/ 347
METRIC RANK
Haitian 5th Grade Correlation Chart
The statistical analysis conducted on geographies consisting of 288,018,742 people shows a moderate negative correlation between the proportion of Haitians and percentage of population with at least 5th grade education in the United States with a correlation coefficient (R) of -0.427 and weighted average of 96.3%. On average, for every 1% (one percent) increase in Haitians within a typical geography, there is a decrease of 0.078% in percentage of population with at least 5th grade education.
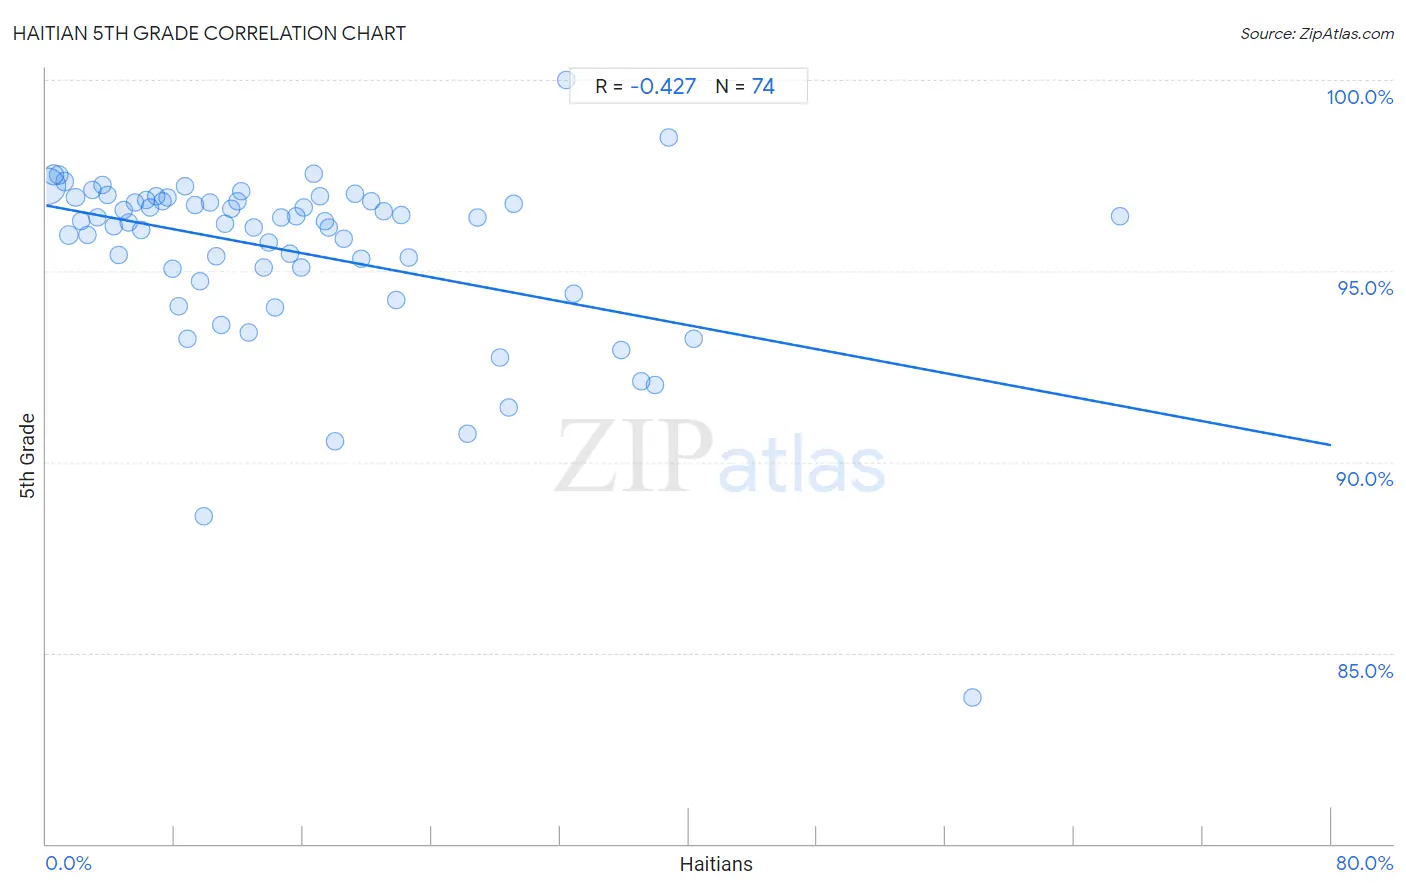
It is essential to understand that the correlation between the percentage of Haitians and percentage of population with at least 5th grade education does not imply a direct cause-and-effect relationship. It remains uncertain whether the presence of Haitians influences an upward or downward trend in the level of percentage of population with at least 5th grade education within an area, or if Haitians simply ended up residing in those areas with higher or lower levels of percentage of population with at least 5th grade education due to other factors.
Demographics Similar to Haitians by 5th Grade
In terms of 5th grade, the demographic groups most similar to Haitians are Immigrants from South Eastern Asia (96.3%, a difference of 0.030%), Immigrants from Dominica (96.2%, a difference of 0.050%), Immigrants (96.2%, a difference of 0.080%), Immigrants from Somalia (96.4%, a difference of 0.13%), and Sri Lankan (96.1%, a difference of 0.13%).
| Demographics | Rating | Rank | 5th Grade |
| British West Indians | 0.0 /100 | #290 | Tragic 96.5% |
| Malaysians | 0.0 /100 | #291 | Tragic 96.5% |
| Somalis | 0.0 /100 | #292 | Tragic 96.5% |
| Immigrants from Grenada | 0.0 /100 | #293 | Tragic 96.5% |
| Immigrants from Eritrea | 0.0 /100 | #294 | Tragic 96.4% |
| Immigrants from Somalia | 0.0 /100 | #295 | Tragic 96.4% |
| Immigrants from South Eastern Asia | 0.0 /100 | #296 | Tragic 96.3% |
| Haitians | 0.0 /100 | #297 | Tragic 96.3% |
| Immigrants from Dominica | 0.0 /100 | #298 | Tragic 96.2% |
| Immigrants | 0.0 /100 | #299 | Tragic 96.2% |
| Sri Lankans | 0.0 /100 | #300 | Tragic 96.1% |
| Immigrants from Cuba | 0.0 /100 | #301 | Tragic 96.1% |
| Guyanese | 0.0 /100 | #302 | Tragic 96.1% |
| Puerto Ricans | 0.0 /100 | #303 | Tragic 96.1% |
| Immigrants from Burma/Myanmar | 0.0 /100 | #304 | Tragic 96.1% |
Haitian 5th Grade Correlation Summary
| Measurement | Haitian Data | 5th Grade Data |
| Minimum | 0.095% | 83.8% |
| Maximum | 66.9% | 100.0% |
| Range | 66.8% | 16.2% |
| Mean | 15.5% | 95.5% |
| Median | 12.4% | 96.3% |
| Interquartile 25% (IQ1) | 6.2% | 95.1% |
| Interquartile 75% (IQ3) | 20.2% | 96.8% |
| Interquartile Range (IQR) | 14.0% | 1.8% |
| Standard Deviation (Sample) | 13.0% | 2.4% |
| Standard Deviation (Population) | 12.9% | 2.4% |
Correlation Details
| Haitian Percentile | Sample Size | 5th Grade |
[ 0.0% - 0.5% ] 0.095% | 203,857,439 | 97.2% |
[ 0.0% - 0.5% ] 0.48% | 30,061,415 | 97.5% |
[ 0.5% - 1.0% ] 0.81% | 12,980,326 | 97.5% |
[ 1.0% - 1.5% ] 1.15% | 6,786,031 | 97.3% |
[ 1.0% - 1.5% ] 1.41% | 12,332,607 | 95.9% |
[ 1.5% - 2.0% ] 1.83% | 3,048,663 | 96.9% |
[ 2.0% - 2.5% ] 2.15% | 2,370,698 | 96.3% |
[ 2.5% - 3.0% ] 2.53% | 1,392,816 | 95.9% |
[ 2.5% - 3.0% ] 2.84% | 1,308,309 | 97.1% |
[ 3.0% - 3.5% ] 3.16% | 2,350,954 | 96.4% |
[ 3.5% - 4.0% ] 3.52% | 904,461 | 97.3% |
[ 3.5% - 4.0% ] 3.82% | 958,850 | 97.0% |
[ 4.0% - 4.5% ] 4.21% | 334,511 | 96.2% |
[ 4.5% - 5.0% ] 4.53% | 764,205 | 95.4% |
[ 4.5% - 5.0% ] 4.85% | 307,720 | 96.6% |
[ 5.0% - 5.5% ] 5.12% | 757,520 | 96.3% |
[ 5.5% - 6.0% ] 5.50% | 415,158 | 96.8% |
[ 5.5% - 6.0% ] 5.88% | 490,287 | 96.1% |
[ 6.0% - 6.5% ] 6.22% | 706,532 | 96.9% |
[ 6.0% - 6.5% ] 6.47% | 160,947 | 96.7% |
[ 6.5% - 7.0% ] 6.84% | 404,412 | 96.9% |
[ 7.0% - 7.5% ] 7.20% | 215,788 | 96.8% |
[ 7.5% - 8.0% ] 7.51% | 450,380 | 96.9% |
[ 7.5% - 8.0% ] 7.85% | 174,274 | 95.1% |
[ 8.0% - 8.5% ] 8.21% | 576,836 | 94.1% |
[ 8.5% - 9.0% ] 8.60% | 207,256 | 97.2% |
[ 8.5% - 9.0% ] 8.81% | 118,037 | 93.2% |
[ 9.0% - 9.5% ] 9.29% | 188,944 | 96.7% |
[ 9.5% - 10.0% ] 9.57% | 79,212 | 94.7% |
[ 9.5% - 10.0% ] 9.81% | 53,626 | 88.6% |
[ 10.0% - 10.5% ] 10.18% | 375,633 | 96.8% |
[ 10.5% - 11.0% ] 10.62% | 34,935 | 95.4% |
[ 10.5% - 11.0% ] 10.88% | 45,801 | 93.6% |
[ 11.0% - 11.5% ] 11.13% | 72,397 | 96.2% |
[ 11.5% - 12.0% ] 11.55% | 32,311 | 96.6% |
[ 11.5% - 12.0% ] 11.92% | 208,772 | 96.8% |
[ 12.0% - 12.5% ] 12.16% | 153,991 | 97.1% |
[ 12.5% - 13.0% ] 12.62% | 98,037 | 93.4% |
[ 12.5% - 13.0% ] 12.90% | 179,860 | 96.2% |
[ 13.5% - 14.0% ] 13.50% | 232,750 | 95.1% |
[ 13.5% - 14.0% ] 13.85% | 180,853 | 95.8% |
[ 14.0% - 14.5% ] 14.26% | 94,219 | 94.0% |
[ 14.5% - 15.0% ] 14.61% | 103,341 | 96.4% |
[ 15.0% - 15.5% ] 15.19% | 144,317 | 95.4% |
[ 15.5% - 16.0% ] 15.59% | 207,337 | 96.4% |
[ 15.5% - 16.0% ] 15.86% | 33,709 | 95.1% |
[ 16.0% - 16.5% ] 16.07% | 26,814 | 96.7% |
[ 16.5% - 17.0% ] 16.65% | 14,597 | 97.6% |
[ 17.0% - 17.5% ] 17.04% | 118,661 | 97.0% |
[ 17.0% - 17.5% ] 17.33% | 62,604 | 96.3% |
[ 17.5% - 18.0% ] 17.57% | 86,232 | 96.1% |
[ 17.5% - 18.0% ] 17.94% | 37,320 | 90.5% |
[ 18.5% - 19.0% ] 18.53% | 64,176 | 95.8% |
[ 19.0% - 19.5% ] 19.19% | 10,946 | 97.0% |
[ 19.5% - 20.0% ] 19.62% | 70,810 | 95.3% |
[ 20.0% - 20.5% ] 20.25% | 326 | 96.8% |
[ 21.0% - 21.5% ] 21.04% | 62,232 | 96.6% |
[ 21.5% - 22.0% ] 21.79% | 83,221 | 94.2% |
[ 22.0% - 22.5% ] 22.08% | 40,276 | 96.5% |
[ 22.5% - 23.0% ] 22.54% | 43,269 | 95.4% |
[ 26.0% - 26.5% ] 26.24% | 6,196 | 90.8% |
[ 26.5% - 27.0% ] 26.83% | 35,914 | 96.4% |
[ 28.0% - 28.5% ] 28.25% | 31,807 | 92.7% |
[ 28.5% - 29.0% ] 28.78% | 24,792 | 91.4% |
[ 29.0% - 29.5% ] 29.13% | 1,775 | 96.8% |
[ 32.0% - 32.5% ] 32.36% | 445 | 100.0% |
[ 32.5% - 33.0% ] 32.84% | 48,326 | 94.4% |
[ 35.5% - 36.0% ] 35.77% | 17,163 | 92.9% |
[ 37.0% - 37.5% ] 37.04% | 52,824 | 92.1% |
[ 37.5% - 38.0% ] 37.88% | 59,854 | 92.0% |
[ 38.5% - 39.0% ] 38.75% | 2,867 | 98.5% |
[ 40.0% - 40.5% ] 40.35% | 58,183 | 93.2% |
[ 57.5% - 58.0% ] 57.69% | 104 | 83.8% |
[ 66.5% - 67.0% ] 66.85% | 531 | 96.4% |