Haitian Unemployment Among Women with Children Ages 6 to 17 years
COMPARE
Haitian
Select to Compare
Unemployment Among Women with Children Ages 6 to 17 years
Haitian Unemployment Among Women with Children Ages 6 to 17 years
10.0%
UNEMPLOYMENT | WOMEN W/ CHILDREN 6 TO 17
0.0/ 100
METRIC RATING
293rd/ 347
METRIC RANK
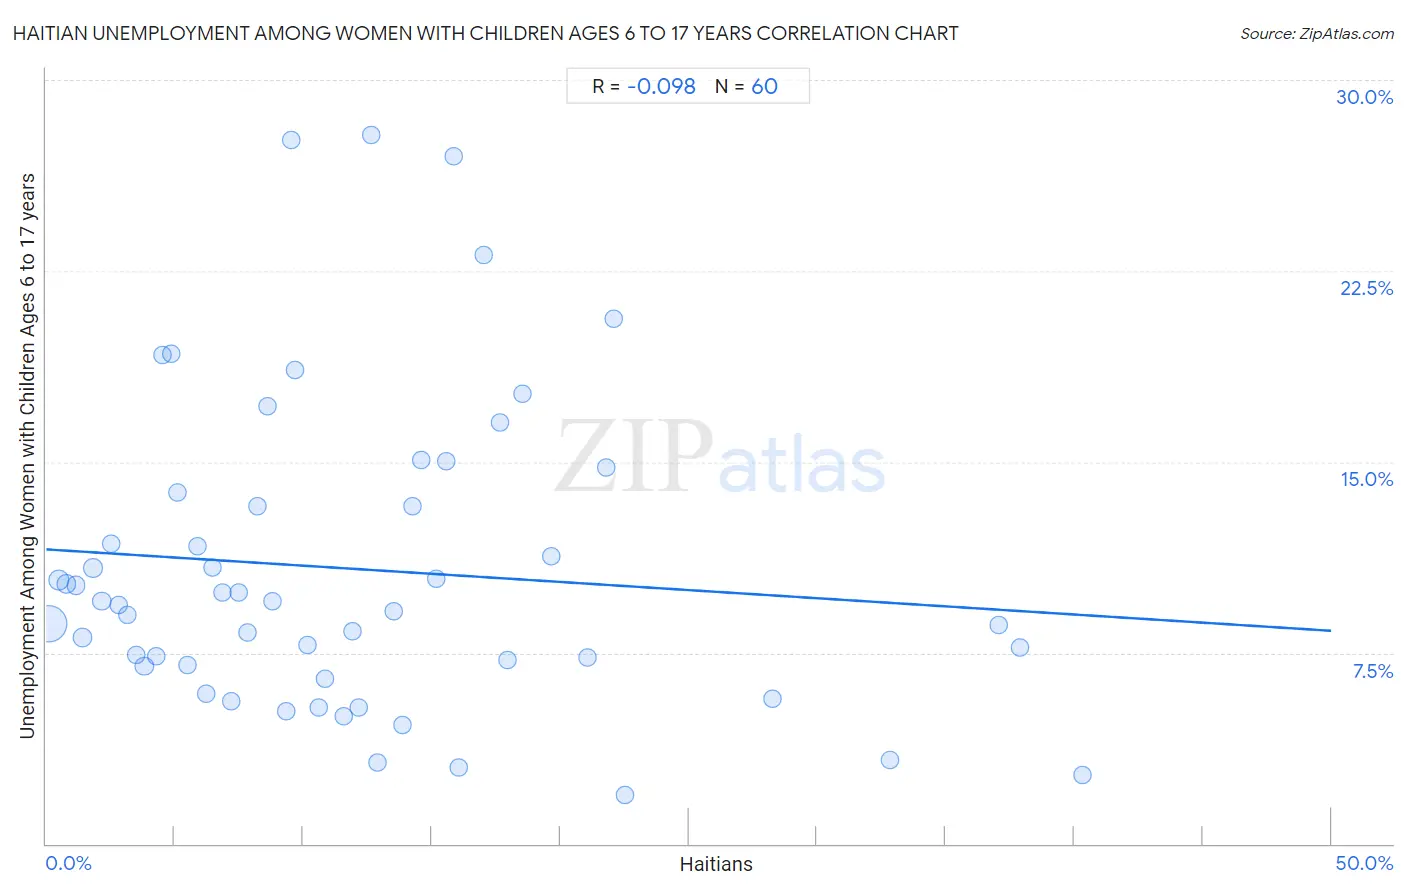
Haitian Unemployment Among Women with Children Ages 6 to 17 years Correlation Chart
The statistical analysis conducted on geographies consisting of 222,141,030 people shows a slight negative correlation between the proportion of Haitians and unemployment rate among women with children between the ages 6 and 17 in the United States with a correlation coefficient (R) of -0.098 and weighted average of 10.0%. On average, for every 1% (one percent) increase in Haitians within a typical geography, there is a decrease of 0.064% in unemployment rate among women with children between the ages 6 and 17.
It is essential to understand that the correlation between the percentage of Haitians and unemployment rate among women with children between the ages 6 and 17 does not imply a direct cause-and-effect relationship. It remains uncertain whether the presence of Haitians influences an upward or downward trend in the level of unemployment rate among women with children between the ages 6 and 17 within an area, or if Haitians simply ended up residing in those areas with higher or lower levels of unemployment rate among women with children between the ages 6 and 17 due to other factors.
Demographics Similar to Haitians by Unemployment Among Women with Children Ages 6 to 17 years
In terms of unemployment among women with children ages 6 to 17 years, the demographic groups most similar to Haitians are Carpatho Rusyn (10.0%, a difference of 0.090%), Ecuadorian (10.0%, a difference of 0.090%), Nonimmigrants (10.0%, a difference of 0.10%), Subsaharan African (10.0%, a difference of 0.12%), and Cherokee (10.0%, a difference of 0.13%).
| Demographics | Rating | Rank | Unemployment Among Women with Children Ages 6 to 17 years |
| Choctaw | 0.0 /100 | #286 | Tragic 9.9% |
| Sierra Leoneans | 0.0 /100 | #287 | Tragic 9.9% |
| Shoshone | 0.0 /100 | #288 | Tragic 10.0% |
| Hondurans | 0.0 /100 | #289 | Tragic 10.0% |
| Sub-Saharan Africans | 0.0 /100 | #290 | Tragic 10.0% |
| Nonimmigrants | 0.0 /100 | #291 | Tragic 10.0% |
| Carpatho Rusyns | 0.0 /100 | #292 | Tragic 10.0% |
| Haitians | 0.0 /100 | #293 | Tragic 10.0% |
| Ecuadorians | 0.0 /100 | #294 | Tragic 10.0% |
| Cherokee | 0.0 /100 | #295 | Tragic 10.0% |
| Immigrants from Western Africa | 0.0 /100 | #296 | Tragic 10.1% |
| Immigrants from Caribbean | 0.0 /100 | #297 | Tragic 10.1% |
| Immigrants from Haiti | 0.0 /100 | #298 | Tragic 10.1% |
| Immigrants from Honduras | 0.0 /100 | #299 | Tragic 10.1% |
| Nigerians | 0.0 /100 | #300 | Tragic 10.1% |
Haitian Unemployment Among Women with Children Ages 6 to 17 years Correlation Summary
| Measurement | Haitian Data | Unemployment Among Women with Children Ages 6 to 17 years Data |
| Minimum | 0.091% | 1.9% |
| Maximum | 40.3% | 27.8% |
| Range | 40.2% | 25.9% |
| Mean | 11.9% | 10.8% |
| Median | 9.9% | 9.4% |
| Interquartile 25% (IQ1) | 5.0% | 7.0% |
| Interquartile 75% (IQ3) | 16.0% | 13.5% |
| Interquartile Range (IQR) | 11.0% | 6.5% |
| Standard Deviation (Sample) | 9.4% | 6.1% |
| Standard Deviation (Population) | 9.3% | 6.1% |
Correlation Details
| Haitian Percentile | Sample Size | Unemployment Among Women with Children Ages 6 to 17 years |
[ 0.0% - 0.5% ] 0.091% | 160,982,912 | 8.7% |
[ 0.0% - 0.5% ] 0.48% | 20,322,751 | 10.3% |
[ 0.5% - 1.0% ] 0.80% | 8,645,800 | 10.2% |
[ 1.0% - 1.5% ] 1.15% | 4,651,962 | 10.1% |
[ 1.0% - 1.5% ] 1.40% | 11,057,521 | 8.1% |
[ 1.5% - 2.0% ] 1.82% | 2,112,608 | 10.8% |
[ 2.0% - 2.5% ] 2.16% | 1,548,896 | 9.5% |
[ 2.5% - 3.0% ] 2.54% | 954,092 | 11.8% |
[ 2.5% - 3.0% ] 2.83% | 972,255 | 9.4% |
[ 3.0% - 3.5% ] 3.16% | 1,959,557 | 9.0% |
[ 3.5% - 4.0% ] 3.51% | 621,852 | 7.4% |
[ 3.5% - 4.0% ] 3.82% | 650,435 | 7.0% |
[ 4.0% - 4.5% ] 4.27% | 207,556 | 7.4% |
[ 4.5% - 5.0% ] 4.51% | 486,109 | 19.2% |
[ 4.5% - 5.0% ] 4.84% | 179,479 | 19.3% |
[ 5.0% - 5.5% ] 5.13% | 646,279 | 13.8% |
[ 5.5% - 6.0% ] 5.51% | 280,729 | 7.0% |
[ 5.5% - 6.0% ] 5.86% | 429,050 | 11.7% |
[ 6.0% - 6.5% ] 6.23% | 571,350 | 5.9% |
[ 6.0% - 6.5% ] 6.45% | 134,901 | 10.8% |
[ 6.5% - 7.0% ] 6.86% | 266,488 | 9.9% |
[ 7.0% - 7.5% ] 7.18% | 120,237 | 5.6% |
[ 7.5% - 8.0% ] 7.50% | 353,807 | 9.9% |
[ 7.5% - 8.0% ] 7.85% | 152,765 | 8.3% |
[ 8.0% - 8.5% ] 8.22% | 521,304 | 13.3% |
[ 8.5% - 9.0% ] 8.61% | 182,067 | 17.2% |
[ 8.5% - 9.0% ] 8.81% | 117,278 | 9.5% |
[ 9.0% - 9.5% ] 9.35% | 134,061 | 5.2% |
[ 9.5% - 10.0% ] 9.51% | 36,580 | 27.6% |
[ 9.5% - 10.0% ] 9.70% | 27,753 | 18.6% |
[ 10.0% - 10.5% ] 10.18% | 374,029 | 7.8% |
[ 10.5% - 11.0% ] 10.62% | 34,374 | 5.3% |
[ 10.5% - 11.0% ] 10.85% | 35,555 | 6.5% |
[ 11.5% - 12.0% ] 11.56% | 27,845 | 5.0% |
[ 11.5% - 12.0% ] 11.93% | 197,741 | 8.4% |
[ 12.0% - 12.5% ] 12.16% | 153,053 | 5.4% |
[ 12.5% - 13.0% ] 12.62% | 86,334 | 27.8% |
[ 12.5% - 13.0% ] 12.91% | 115,400 | 3.2% |
[ 13.5% - 14.0% ] 13.50% | 231,368 | 9.1% |
[ 13.5% - 14.0% ] 13.85% | 180,853 | 4.7% |
[ 14.0% - 14.5% ] 14.26% | 94,219 | 13.3% |
[ 14.5% - 15.0% ] 14.61% | 103,341 | 15.1% |
[ 15.0% - 15.5% ] 15.20% | 139,753 | 10.4% |
[ 15.5% - 16.0% ] 15.58% | 204,145 | 15.0% |
[ 15.5% - 16.0% ] 15.86% | 30,230 | 27.0% |
[ 16.0% - 16.5% ] 16.07% | 26,814 | 3.0% |
[ 17.0% - 17.5% ] 17.04% | 118,661 | 23.1% |
[ 17.5% - 18.0% ] 17.67% | 46,734 | 16.5% |
[ 17.5% - 18.0% ] 17.94% | 32,963 | 7.2% |
[ 18.5% - 19.0% ] 18.53% | 62,827 | 17.7% |
[ 19.5% - 20.0% ] 19.63% | 62,566 | 11.3% |
[ 21.0% - 21.5% ] 21.04% | 62,232 | 7.3% |
[ 21.5% - 22.0% ] 21.79% | 83,221 | 14.8% |
[ 22.0% - 22.5% ] 22.08% | 37,533 | 20.6% |
[ 22.5% - 23.0% ] 22.54% | 43,269 | 1.9% |
[ 28.0% - 28.5% ] 28.25% | 31,807 | 5.7% |
[ 32.5% - 33.0% ] 32.84% | 48,326 | 3.3% |
[ 37.0% - 37.5% ] 37.04% | 52,824 | 8.6% |
[ 37.5% - 38.0% ] 37.88% | 59,854 | 7.7% |
[ 40.0% - 40.5% ] 40.34% | 34,725 | 2.7% |