Haitian Disability Age Under 5
COMPARE
Haitian
Select to Compare
Disability Age Under 5
Haitian Disability Age Under 5
1.3%
DISABILITY | AGE UNDER 5
39.9/ 100
METRIC RATING
188th/ 347
METRIC RANK
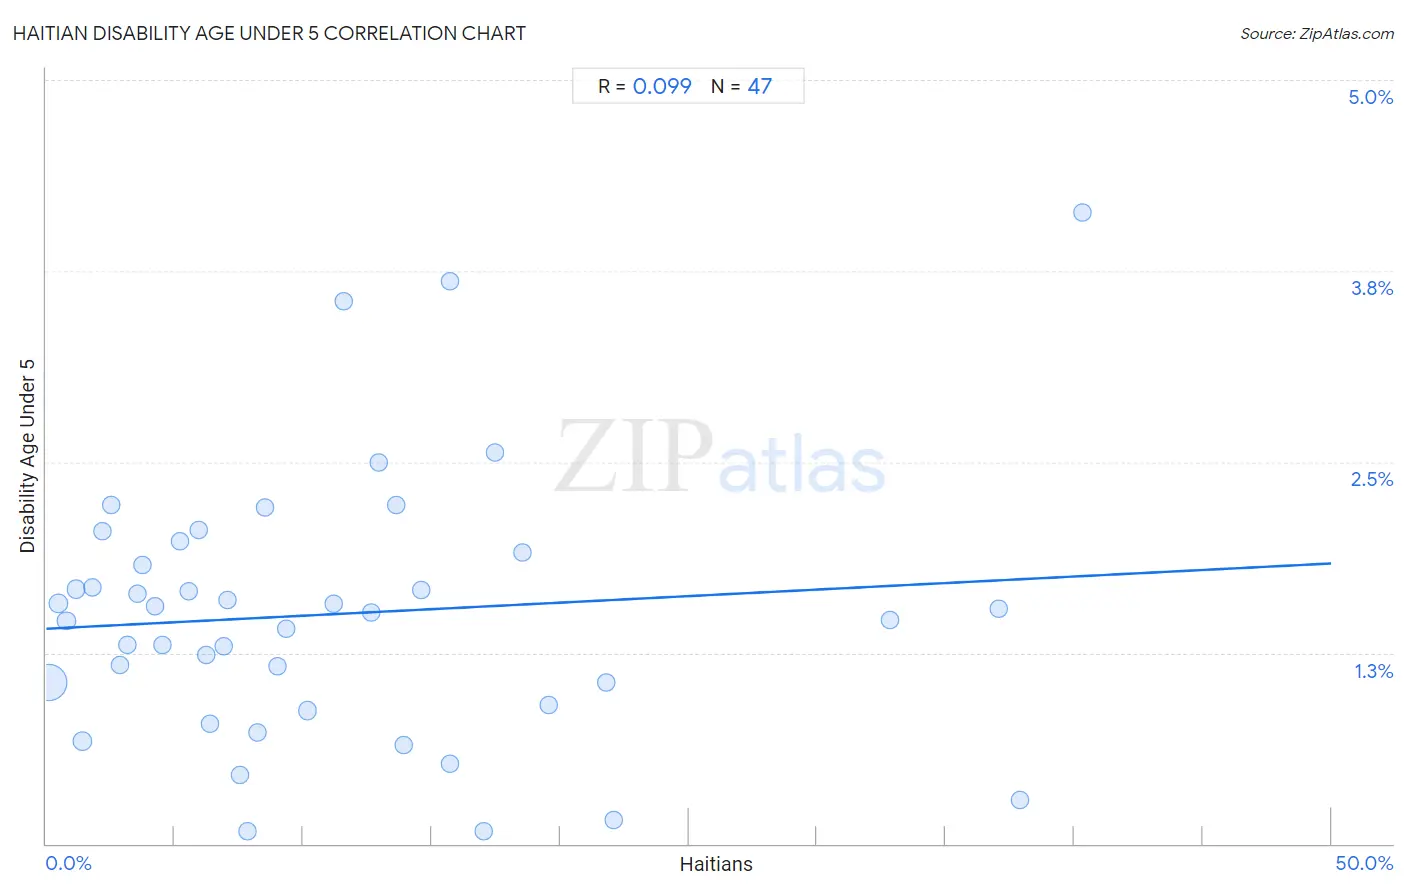
Haitian Disability Age Under 5 Correlation Chart
The statistical analysis conducted on geographies consisting of 169,174,150 people shows a slight positive correlation between the proportion of Haitians and percentage of population with a disability under the age of 5 in the United States with a correlation coefficient (R) of 0.099 and weighted average of 1.3%. On average, for every 1% (one percent) increase in Haitians within a typical geography, there is an increase of 0.0086% in percentage of population with a disability under the age of 5.
It is essential to understand that the correlation between the percentage of Haitians and percentage of population with a disability under the age of 5 does not imply a direct cause-and-effect relationship. It remains uncertain whether the presence of Haitians influences an upward or downward trend in the level of percentage of population with a disability under the age of 5 within an area, or if Haitians simply ended up residing in those areas with higher or lower levels of percentage of population with a disability under the age of 5 due to other factors.
Demographics Similar to Haitians by Disability Age Under 5
In terms of disability age under 5, the demographic groups most similar to Haitians are Immigrants from Haiti (1.3%, a difference of 0.020%), Peruvian (1.3%, a difference of 0.22%), Cuban (1.2%, a difference of 0.23%), Immigrants from Western Africa (1.2%, a difference of 0.24%), and Palestinian (1.2%, a difference of 0.29%).
| Demographics | Rating | Rank | Disability Age Under 5 |
| Macedonians | 43.7 /100 | #181 | Average 1.2% |
| Immigrants from Peru | 43.7 /100 | #181 | Average 1.2% |
| Immigrants from Saudi Arabia | 43.3 /100 | #183 | Average 1.2% |
| Palestinians | 43.0 /100 | #184 | Average 1.2% |
| Immigrants from Western Africa | 42.5 /100 | #185 | Average 1.2% |
| Cubans | 42.5 /100 | #186 | Average 1.2% |
| Immigrants from Haiti | 40.2 /100 | #187 | Average 1.3% |
| Haitians | 39.9 /100 | #188 | Fair 1.3% |
| Peruvians | 37.6 /100 | #189 | Fair 1.3% |
| Immigrants from Laos | 36.6 /100 | #190 | Fair 1.3% |
| Mexican American Indians | 36.6 /100 | #191 | Fair 1.3% |
| Immigrants from Bosnia and Herzegovina | 36.5 /100 | #192 | Fair 1.3% |
| Immigrants from Sierra Leone | 36.5 /100 | #193 | Fair 1.3% |
| Immigrants from North Macedonia | 34.7 /100 | #194 | Fair 1.3% |
| U.S. Virgin Islanders | 34.4 /100 | #195 | Fair 1.3% |
Haitian Disability Age Under 5 Correlation Summary
| Measurement | Haitian Data | Disability Age Under 5 Data |
| Minimum | 0.087% | 0.082% |
| Maximum | 40.3% | 4.1% |
| Range | 40.3% | 4.0% |
| Mean | 11.1% | 1.5% |
| Median | 8.2% | 1.5% |
| Interquartile 25% (IQ1) | 3.8% | 0.90% |
| Interquartile 75% (IQ3) | 15.7% | 1.9% |
| Interquartile Range (IQR) | 11.9% | 1.0% |
| Standard Deviation (Sample) | 9.9% | 0.86% |
| Standard Deviation (Population) | 9.8% | 0.85% |
Correlation Details
| Haitian Percentile | Sample Size | Disability Age Under 5 |
[ 0.0% - 0.5% ] 0.087% | 127,476,450 | 1.1% |
[ 0.0% - 0.5% ] 0.48% | 13,178,472 | 1.6% |
[ 0.5% - 1.0% ] 0.80% | 6,212,816 | 1.5% |
[ 1.0% - 1.5% ] 1.15% | 2,855,720 | 1.7% |
[ 1.0% - 1.5% ] 1.39% | 9,959,758 | 0.67% |
[ 1.5% - 2.0% ] 1.79% | 1,234,264 | 1.7% |
[ 2.0% - 2.5% ] 2.18% | 902,518 | 2.0% |
[ 2.5% - 3.0% ] 2.55% | 442,545 | 2.2% |
[ 2.5% - 3.0% ] 2.88% | 368,965 | 1.2% |
[ 3.0% - 3.5% ] 3.16% | 1,862,118 | 1.3% |
[ 3.5% - 4.0% ] 3.53% | 405,339 | 1.6% |
[ 3.5% - 4.0% ] 3.76% | 214,390 | 1.8% |
[ 4.0% - 4.5% ] 4.24% | 220,940 | 1.6% |
[ 4.5% - 5.0% ] 4.53% | 573,453 | 1.3% |
[ 5.0% - 5.5% ] 5.18% | 142,994 | 2.0% |
[ 5.5% - 6.0% ] 5.52% | 155,281 | 1.7% |
[ 5.5% - 6.0% ] 5.94% | 125,076 | 2.1% |
[ 6.0% - 6.5% ] 6.22% | 459,704 | 1.2% |
[ 6.0% - 6.5% ] 6.39% | 49,890 | 0.79% |
[ 6.5% - 7.0% ] 6.91% | 83,445 | 1.3% |
[ 7.0% - 7.5% ] 7.05% | 32,960 | 1.6% |
[ 7.5% - 8.0% ] 7.55% | 294,291 | 0.45% |
[ 7.5% - 8.0% ] 7.83% | 70,555 | 0.082% |
[ 8.0% - 8.5% ] 8.24% | 319,704 | 0.73% |
[ 8.5% - 9.0% ] 8.52% | 79,523 | 2.2% |
[ 9.0% - 9.5% ] 9.01% | 28,712 | 1.2% |
[ 9.0% - 9.5% ] 9.36% | 86,455 | 1.4% |
[ 10.0% - 10.5% ] 10.18% | 325,454 | 0.87% |
[ 11.0% - 11.5% ] 11.21% | 38,874 | 1.6% |
[ 11.5% - 12.0% ] 11.56% | 27,845 | 3.6% |
[ 12.5% - 13.0% ] 12.66% | 69,438 | 1.5% |
[ 12.5% - 13.0% ] 12.95% | 71,749 | 2.5% |
[ 13.5% - 14.0% ] 13.61% | 60,009 | 2.2% |
[ 13.5% - 14.0% ] 13.92% | 100,082 | 0.65% |
[ 14.5% - 15.0% ] 14.59% | 55,145 | 1.7% |
[ 15.5% - 16.0% ] 15.69% | 75,435 | 0.53% |
[ 15.5% - 16.0% ] 15.72% | 6,661 | 3.7% |
[ 17.0% - 17.5% ] 17.04% | 80,068 | 0.084% |
[ 17.0% - 17.5% ] 17.46% | 39,498 | 2.6% |
[ 18.5% - 19.0% ] 18.53% | 62,827 | 1.9% |
[ 19.5% - 20.0% ] 19.53% | 8,244 | 0.90% |
[ 21.5% - 22.0% ] 21.79% | 83,221 | 1.1% |
[ 22.0% - 22.5% ] 22.08% | 37,533 | 0.16% |
[ 32.5% - 33.0% ] 32.84% | 48,326 | 1.5% |
[ 37.0% - 37.5% ] 37.04% | 52,824 | 1.5% |
[ 37.5% - 38.0% ] 37.88% | 59,854 | 0.28% |
[ 40.0% - 40.5% ] 40.34% | 34,725 | 4.1% |