Haitian 3 or more Vehicles in Household
COMPARE
Haitian
Select to Compare
3 or more Vehicles in Household
Haitian 3 or more Vehicles in Household
15.5%
3+ VEHICLES AVAILABLE
0.0/ 100
METRIC RATING
315th/ 347
METRIC RANK
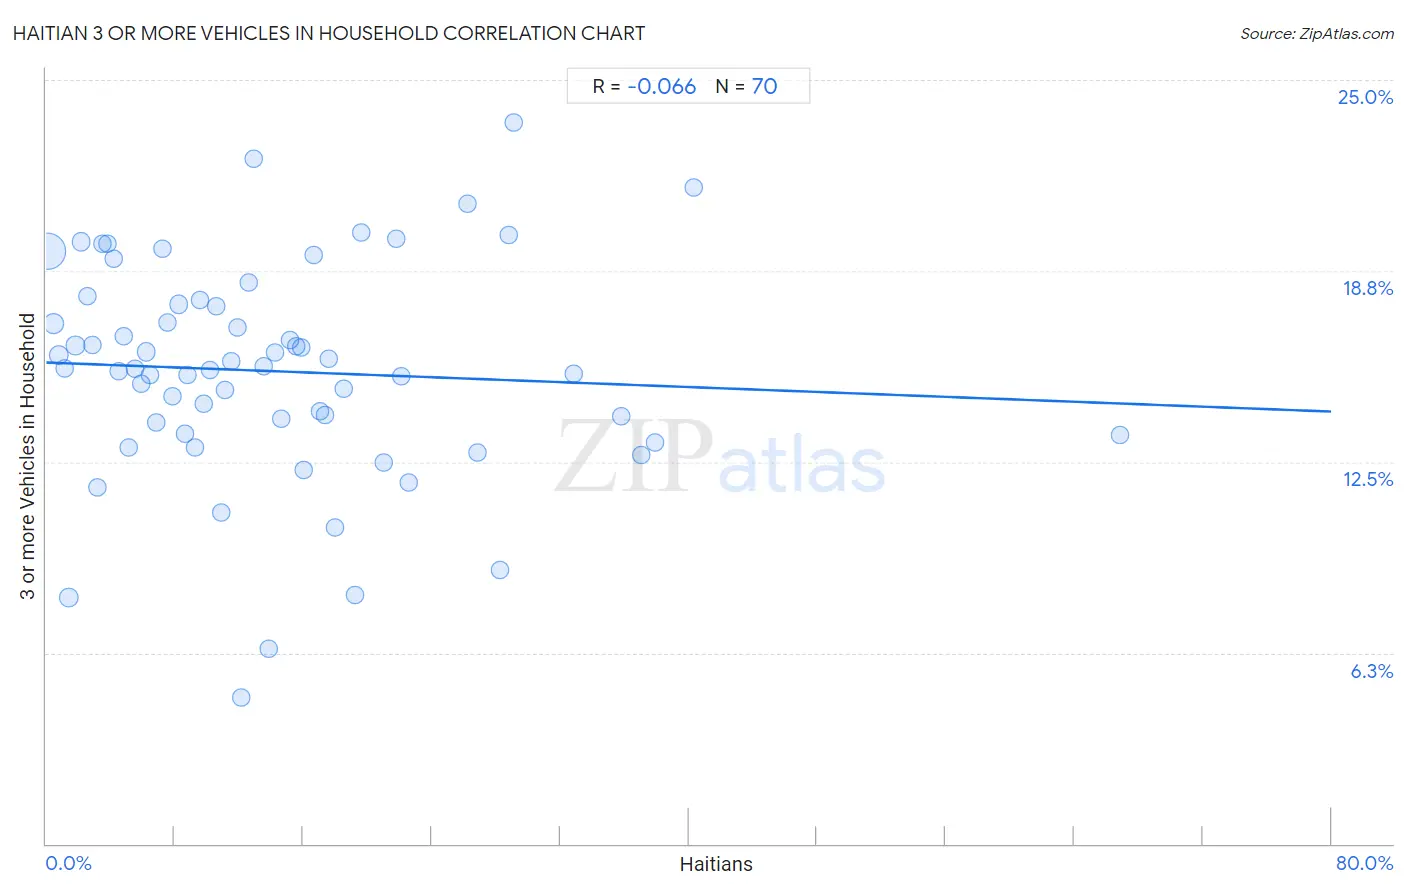
Haitian 3 or more Vehicles in Household Correlation Chart
The statistical analysis conducted on geographies consisting of 287,611,480 people shows a slight negative correlation between the proportion of Haitians and percentage of households with 3 or more vehicles available in the United States with a correlation coefficient (R) of -0.066 and weighted average of 15.5%. On average, for every 1% (one percent) increase in Haitians within a typical geography, there is a decrease of 0.020% in percentage of households with 3 or more vehicles available.
It is essential to understand that the correlation between the percentage of Haitians and percentage of households with 3 or more vehicles available does not imply a direct cause-and-effect relationship. It remains uncertain whether the presence of Haitians influences an upward or downward trend in the level of percentage of households with 3 or more vehicles available within an area, or if Haitians simply ended up residing in those areas with higher or lower levels of percentage of households with 3 or more vehicles available due to other factors.
Demographics Similar to Haitians by 3 or more Vehicles in Household
In terms of 3 or more vehicles in household, the demographic groups most similar to Haitians are Immigrants from Belarus (15.5%, a difference of 0.32%), U.S. Virgin Islander (15.4%, a difference of 0.52%), Immigrants from Israel (15.6%, a difference of 0.96%), Puerto Rican (15.6%, a difference of 0.98%), and Jamaican (15.2%, a difference of 1.7%).
| Demographics | Rating | Rank | 3 or more Vehicles in Household |
| Houma | 0.0 /100 | #308 | Tragic 16.1% |
| Immigrants from Somalia | 0.0 /100 | #309 | Tragic 15.9% |
| Moroccans | 0.0 /100 | #310 | Tragic 15.9% |
| Albanians | 0.0 /100 | #311 | Tragic 15.8% |
| Puerto Ricans | 0.0 /100 | #312 | Tragic 15.6% |
| Immigrants from Israel | 0.0 /100 | #313 | Tragic 15.6% |
| Immigrants from Belarus | 0.0 /100 | #314 | Tragic 15.5% |
| Haitians | 0.0 /100 | #315 | Tragic 15.5% |
| U.S. Virgin Islanders | 0.0 /100 | #316 | Tragic 15.4% |
| Jamaicans | 0.0 /100 | #317 | Tragic 15.2% |
| Immigrants from Haiti | 0.0 /100 | #318 | Tragic 15.2% |
| Cape Verdeans | 0.0 /100 | #319 | Tragic 15.0% |
| Yup'ik | 0.0 /100 | #320 | Tragic 14.8% |
| Immigrants from Jamaica | 0.0 /100 | #321 | Tragic 14.7% |
| Immigrants from West Indies | 0.0 /100 | #322 | Tragic 14.6% |
Haitian 3 or more Vehicles in Household Correlation Summary
| Measurement | Haitian Data | 3 or more Vehicles in Household Data |
| Minimum | 0.095% | 4.8% |
| Maximum | 66.9% | 23.6% |
| Range | 66.8% | 18.8% |
| Mean | 14.2% | 15.5% |
| Median | 11.7% | 15.6% |
| Interquartile 25% (IQ1) | 5.9% | 13.4% |
| Interquartile 75% (IQ3) | 18.5% | 17.7% |
| Interquartile Range (IQR) | 12.6% | 4.2% |
| Standard Deviation (Sample) | 11.7% | 3.6% |
| Standard Deviation (Population) | 11.7% | 3.6% |
Correlation Details
| Haitian Percentile | Sample Size | 3 or more Vehicles in Household |
[ 0.0% - 0.5% ] 0.095% | 203,637,250 | 19.4% |
[ 0.0% - 0.5% ] 0.48% | 29,984,227 | 17.0% |
[ 0.5% - 1.0% ] 0.81% | 12,928,501 | 16.0% |
[ 1.0% - 1.5% ] 1.15% | 6,767,267 | 15.6% |
[ 1.0% - 1.5% ] 1.41% | 12,315,413 | 8.0% |
[ 1.5% - 2.0% ] 1.83% | 3,042,858 | 16.3% |
[ 2.0% - 2.5% ] 2.15% | 2,368,210 | 19.7% |
[ 2.5% - 3.0% ] 2.53% | 1,392,816 | 17.9% |
[ 2.5% - 3.0% ] 2.84% | 1,302,490 | 16.3% |
[ 3.0% - 3.5% ] 3.16% | 2,348,082 | 11.7% |
[ 3.5% - 4.0% ] 3.52% | 904,461 | 19.6% |
[ 3.5% - 4.0% ] 3.82% | 958,850 | 19.6% |
[ 4.0% - 4.5% ] 4.21% | 334,104 | 19.2% |
[ 4.5% - 5.0% ] 4.53% | 763,934 | 15.5% |
[ 4.5% - 5.0% ] 4.85% | 307,720 | 16.6% |
[ 5.0% - 5.5% ] 5.12% | 757,520 | 13.0% |
[ 5.5% - 6.0% ] 5.50% | 414,815 | 15.5% |
[ 5.5% - 6.0% ] 5.88% | 490,287 | 15.1% |
[ 6.0% - 6.5% ] 6.22% | 706,532 | 16.1% |
[ 6.0% - 6.5% ] 6.47% | 160,947 | 15.3% |
[ 6.5% - 7.0% ] 6.84% | 404,412 | 13.8% |
[ 7.0% - 7.5% ] 7.20% | 215,788 | 19.5% |
[ 7.5% - 8.0% ] 7.51% | 450,380 | 17.1% |
[ 7.5% - 8.0% ] 7.85% | 174,274 | 14.6% |
[ 8.0% - 8.5% ] 8.21% | 576,572 | 17.7% |
[ 8.5% - 9.0% ] 8.60% | 207,256 | 13.4% |
[ 8.5% - 9.0% ] 8.81% | 118,037 | 15.3% |
[ 9.0% - 9.5% ] 9.29% | 188,944 | 13.0% |
[ 9.5% - 10.0% ] 9.57% | 79,212 | 17.8% |
[ 9.5% - 10.0% ] 9.81% | 53,626 | 14.4% |
[ 10.0% - 10.5% ] 10.18% | 375,633 | 15.5% |
[ 10.5% - 11.0% ] 10.62% | 34,935 | 17.6% |
[ 10.5% - 11.0% ] 10.88% | 45,801 | 10.8% |
[ 11.0% - 11.5% ] 11.13% | 72,397 | 14.9% |
[ 11.5% - 12.0% ] 11.55% | 32,311 | 15.8% |
[ 11.5% - 12.0% ] 11.92% | 208,772 | 16.9% |
[ 12.0% - 12.5% ] 12.16% | 153,991 | 4.8% |
[ 12.5% - 13.0% ] 12.62% | 98,037 | 18.4% |
[ 12.5% - 13.0% ] 12.90% | 179,860 | 22.4% |
[ 13.5% - 14.0% ] 13.50% | 232,750 | 15.6% |
[ 13.5% - 14.0% ] 13.85% | 180,853 | 6.4% |
[ 14.0% - 14.5% ] 14.26% | 94,219 | 16.1% |
[ 14.5% - 15.0% ] 14.61% | 103,341 | 13.9% |
[ 15.0% - 15.5% ] 15.19% | 144,317 | 16.5% |
[ 15.5% - 16.0% ] 15.59% | 207,337 | 16.3% |
[ 15.5% - 16.0% ] 15.86% | 33,709 | 16.2% |
[ 16.0% - 16.5% ] 16.07% | 26,814 | 12.2% |
[ 16.5% - 17.0% ] 16.65% | 14,585 | 19.3% |
[ 17.0% - 17.5% ] 17.04% | 118,661 | 14.2% |
[ 17.0% - 17.5% ] 17.33% | 62,604 | 14.0% |
[ 17.5% - 18.0% ] 17.57% | 86,232 | 15.9% |
[ 17.5% - 18.0% ] 17.94% | 37,241 | 10.4% |
[ 18.5% - 19.0% ] 18.53% | 64,176 | 14.9% |
[ 19.0% - 19.5% ] 19.19% | 10,946 | 8.2% |
[ 19.5% - 20.0% ] 19.62% | 70,810 | 20.0% |
[ 21.0% - 21.5% ] 21.04% | 62,232 | 12.5% |
[ 21.5% - 22.0% ] 21.79% | 83,221 | 19.8% |
[ 22.0% - 22.5% ] 22.08% | 40,276 | 15.3% |
[ 22.5% - 23.0% ] 22.54% | 43,269 | 11.8% |
[ 26.0% - 26.5% ] 26.24% | 6,196 | 20.9% |
[ 26.5% - 27.0% ] 26.83% | 35,914 | 12.8% |
[ 28.0% - 28.5% ] 28.25% | 31,807 | 9.0% |
[ 28.5% - 29.0% ] 28.78% | 24,792 | 19.9% |
[ 29.0% - 29.5% ] 29.13% | 1,775 | 23.6% |
[ 32.5% - 33.0% ] 32.84% | 48,326 | 15.4% |
[ 35.5% - 36.0% ] 35.77% | 17,163 | 14.0% |
[ 37.0% - 37.5% ] 37.04% | 52,824 | 12.7% |
[ 37.5% - 38.0% ] 37.88% | 59,854 | 13.1% |
[ 40.0% - 40.5% ] 40.35% | 58,183 | 21.5% |
[ 66.5% - 67.0% ] 66.85% | 531 | 13.4% |