Ghanaian 3 or more Vehicles in Household
COMPARE
Ghanaian
Select to Compare
3 or more Vehicles in Household
Ghanaian 3 or more Vehicles in Household
16.4%
3+ VEHICLES AVAILABLE
0.0/ 100
METRIC RATING
304th/ 347
METRIC RANK
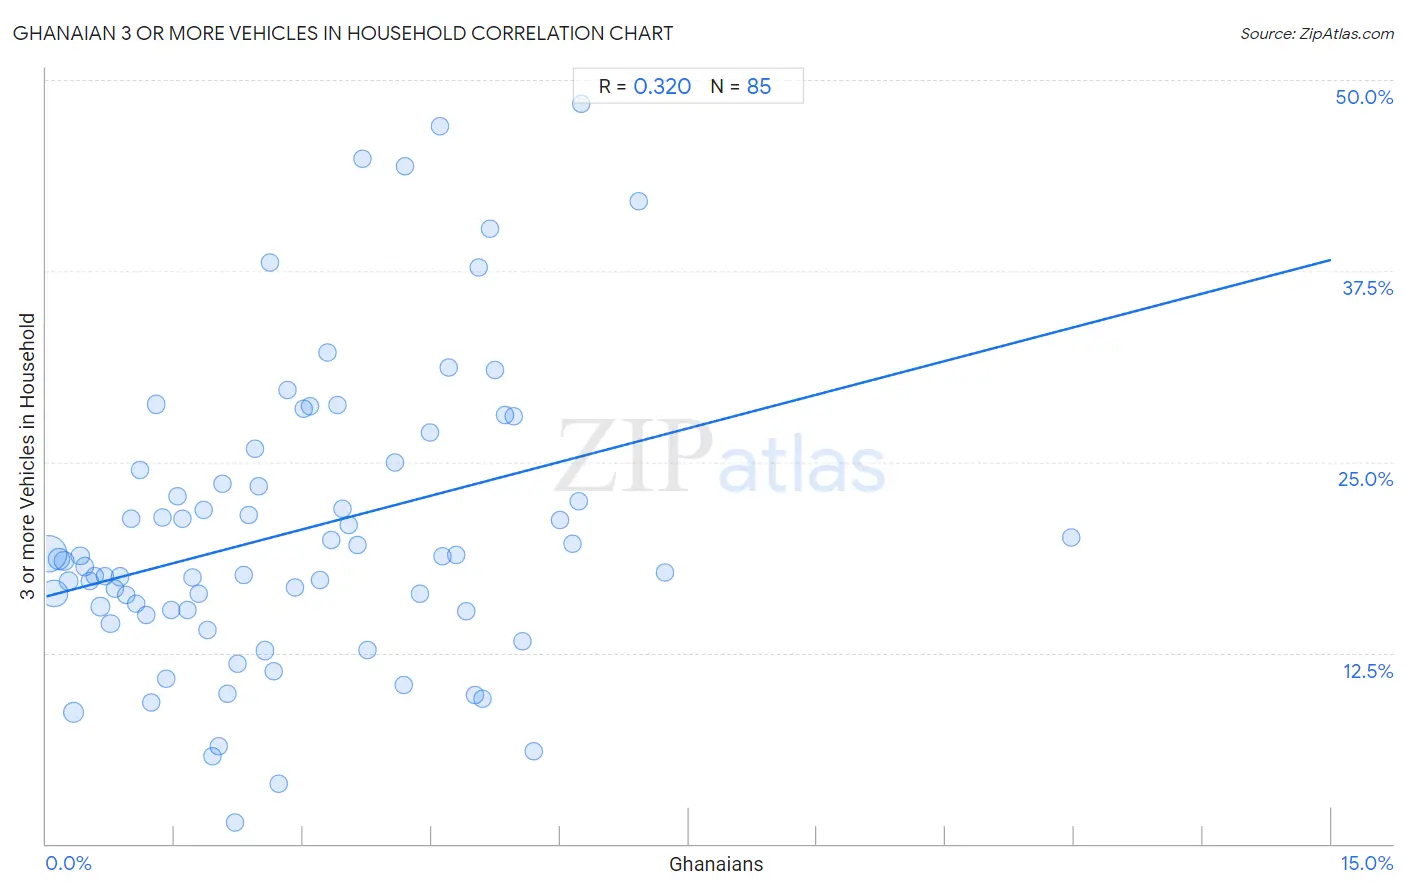
Ghanaian 3 or more Vehicles in Household Correlation Chart
The statistical analysis conducted on geographies consisting of 190,488,118 people shows a mild positive correlation between the proportion of Ghanaians and percentage of households with 3 or more vehicles available in the United States with a correlation coefficient (R) of 0.320 and weighted average of 16.4%. On average, for every 1% (one percent) increase in Ghanaians within a typical geography, there is an increase of 1.5% in percentage of households with 3 or more vehicles available.
It is essential to understand that the correlation between the percentage of Ghanaians and percentage of households with 3 or more vehicles available does not imply a direct cause-and-effect relationship. It remains uncertain whether the presence of Ghanaians influences an upward or downward trend in the level of percentage of households with 3 or more vehicles available within an area, or if Ghanaians simply ended up residing in those areas with higher or lower levels of percentage of households with 3 or more vehicles available due to other factors.
Demographics Similar to Ghanaians by 3 or more Vehicles in Household
In terms of 3 or more vehicles in household, the demographic groups most similar to Ghanaians are Immigrants from Morocco (16.3%, a difference of 0.26%), Immigrants from Serbia (16.4%, a difference of 0.47%), Immigrants from Greece (16.5%, a difference of 0.78%), Somali (16.2%, a difference of 1.1%), and Paraguayan (16.6%, a difference of 1.2%).
| Demographics | Rating | Rank | 3 or more Vehicles in Household |
| Israelis | 0.1 /100 | #297 | Tragic 16.8% |
| Immigrants from Zaire | 0.1 /100 | #298 | Tragic 16.7% |
| Immigrants from South America | 0.1 /100 | #299 | Tragic 16.7% |
| Cypriots | 0.0 /100 | #300 | Tragic 16.6% |
| Paraguayans | 0.0 /100 | #301 | Tragic 16.6% |
| Immigrants from Greece | 0.0 /100 | #302 | Tragic 16.5% |
| Immigrants from Serbia | 0.0 /100 | #303 | Tragic 16.4% |
| Ghanaians | 0.0 /100 | #304 | Tragic 16.4% |
| Immigrants from Morocco | 0.0 /100 | #305 | Tragic 16.3% |
| Somalis | 0.0 /100 | #306 | Tragic 16.2% |
| Immigrants from Ghana | 0.0 /100 | #307 | Tragic 16.2% |
| Houma | 0.0 /100 | #308 | Tragic 16.1% |
| Immigrants from Somalia | 0.0 /100 | #309 | Tragic 15.9% |
| Moroccans | 0.0 /100 | #310 | Tragic 15.9% |
| Albanians | 0.0 /100 | #311 | Tragic 15.8% |
Ghanaian 3 or more Vehicles in Household Correlation Summary
| Measurement | Ghanaian Data | 3 or more Vehicles in Household Data |
| Minimum | 0.028% | 1.4% |
| Maximum | 12.0% | 48.5% |
| Range | 11.9% | 47.1% |
| Mean | 2.9% | 20.5% |
| Median | 2.5% | 18.7% |
| Interquartile 25% (IQ1) | 1.3% | 15.3% |
| Interquartile 75% (IQ3) | 4.5% | 24.7% |
| Interquartile Range (IQR) | 3.3% | 9.4% |
| Standard Deviation (Sample) | 2.1% | 9.7% |
| Standard Deviation (Population) | 2.1% | 9.7% |
Correlation Details
| Ghanaian Percentile | Sample Size | 3 or more Vehicles in Household |
[ 0.0% - 0.5% ] 0.028% | 84,681,820 | 19.0% |
[ 0.0% - 0.5% ] 0.088% | 42,461,986 | 16.4% |
[ 0.0% - 0.5% ] 0.15% | 14,958,920 | 18.7% |
[ 0.0% - 0.5% ] 0.21% | 8,599,566 | 18.5% |
[ 0.0% - 0.5% ] 0.27% | 6,202,288 | 17.2% |
[ 0.0% - 0.5% ] 0.32% | 12,762,071 | 8.6% |
[ 0.0% - 0.5% ] 0.39% | 3,380,952 | 18.9% |
[ 0.0% - 0.5% ] 0.45% | 2,792,619 | 18.1% |
[ 0.5% - 1.0% ] 0.51% | 1,743,625 | 17.2% |
[ 0.5% - 1.0% ] 0.57% | 1,311,289 | 17.5% |
[ 0.5% - 1.0% ] 0.63% | 1,987,905 | 15.5% |
[ 0.5% - 1.0% ] 0.68% | 798,820 | 17.5% |
[ 0.5% - 1.0% ] 0.75% | 1,414,209 | 14.4% |
[ 0.5% - 1.0% ] 0.80% | 666,045 | 16.7% |
[ 0.5% - 1.0% ] 0.87% | 530,607 | 17.5% |
[ 0.5% - 1.0% ] 0.93% | 447,036 | 16.3% |
[ 0.5% - 1.0% ] 0.99% | 364,315 | 21.2% |
[ 1.0% - 1.5% ] 1.05% | 567,076 | 15.7% |
[ 1.0% - 1.5% ] 1.10% | 223,255 | 24.5% |
[ 1.0% - 1.5% ] 1.17% | 321,189 | 15.0% |
[ 1.0% - 1.5% ] 1.22% | 311,825 | 9.3% |
[ 1.0% - 1.5% ] 1.28% | 443,712 | 28.8% |
[ 1.0% - 1.5% ] 1.35% | 191,762 | 21.3% |
[ 1.0% - 1.5% ] 1.40% | 339,224 | 10.8% |
[ 1.0% - 1.5% ] 1.46% | 230,746 | 15.3% |
[ 1.5% - 2.0% ] 1.53% | 62,787 | 22.8% |
[ 1.5% - 2.0% ] 1.58% | 193,038 | 21.3% |
[ 1.5% - 2.0% ] 1.65% | 209,236 | 15.3% |
[ 1.5% - 2.0% ] 1.71% | 115,620 | 17.4% |
[ 1.5% - 2.0% ] 1.78% | 74,718 | 16.4% |
[ 1.5% - 2.0% ] 1.84% | 252,368 | 21.8% |
[ 1.5% - 2.0% ] 1.88% | 280,228 | 14.0% |
[ 1.5% - 2.0% ] 1.94% | 74,483 | 5.8% |
[ 2.0% - 2.5% ] 2.02% | 125,871 | 6.4% |
[ 2.0% - 2.5% ] 2.06% | 80,818 | 23.5% |
[ 2.0% - 2.5% ] 2.12% | 118,697 | 9.8% |
[ 2.0% - 2.5% ] 2.20% | 1,999 | 1.4% |
[ 2.0% - 2.5% ] 2.23% | 14,296 | 11.8% |
[ 2.0% - 2.5% ] 2.31% | 36,119 | 17.6% |
[ 2.0% - 2.5% ] 2.37% | 38,913 | 21.5% |
[ 2.0% - 2.5% ] 2.44% | 84,014 | 25.9% |
[ 2.0% - 2.5% ] 2.49% | 6,916 | 23.4% |
[ 2.5% - 3.0% ] 2.55% | 231,804 | 12.6% |
[ 2.5% - 3.0% ] 2.61% | 16,183 | 38.1% |
[ 2.5% - 3.0% ] 2.66% | 6,773 | 11.3% |
[ 2.5% - 3.0% ] 2.72% | 181,389 | 3.9% |
[ 2.5% - 3.0% ] 2.81% | 13,927 | 29.7% |
[ 2.5% - 3.0% ] 2.91% | 9,389 | 16.8% |
[ 3.0% - 3.5% ] 3.01% | 47,793 | 28.5% |
[ 3.0% - 3.5% ] 3.08% | 3,638 | 28.7% |
[ 3.0% - 3.5% ] 3.19% | 2,694 | 17.3% |
[ 3.0% - 3.5% ] 3.28% | 22,049 | 32.1% |
[ 3.0% - 3.5% ] 3.33% | 38,632 | 19.9% |
[ 3.0% - 3.5% ] 3.40% | 19,605 | 28.7% |
[ 3.0% - 3.5% ] 3.46% | 1,705 | 21.9% |
[ 3.5% - 4.0% ] 3.52% | 36,265 | 20.9% |
[ 3.5% - 4.0% ] 3.64% | 22,966 | 19.5% |
[ 3.5% - 4.0% ] 3.70% | 703 | 44.8% |
[ 3.5% - 4.0% ] 3.75% | 55,168 | 12.6% |
[ 4.0% - 4.5% ] 4.08% | 19,938 | 24.9% |
[ 4.0% - 4.5% ] 4.17% | 30,590 | 10.4% |
[ 4.0% - 4.5% ] 4.19% | 2,980 | 44.4% |
[ 4.0% - 4.5% ] 4.37% | 229 | 16.3% |
[ 4.0% - 4.5% ] 4.47% | 72,215 | 26.9% |
[ 4.5% - 5.0% ] 4.60% | 630 | 47.0% |
[ 4.5% - 5.0% ] 4.63% | 3,135 | 18.8% |
[ 4.5% - 5.0% ] 4.70% | 1,935 | 31.2% |
[ 4.5% - 5.0% ] 4.79% | 376 | 18.9% |
[ 4.5% - 5.0% ] 4.91% | 23,110 | 15.3% |
[ 5.0% - 5.5% ] 5.01% | 43,231 | 9.7% |
[ 5.0% - 5.5% ] 5.05% | 297 | 37.7% |
[ 5.0% - 5.5% ] 5.09% | 2,474 | 9.5% |
[ 5.0% - 5.5% ] 5.18% | 733 | 40.2% |
[ 5.0% - 5.5% ] 5.24% | 15,508 | 31.0% |
[ 5.0% - 5.5% ] 5.35% | 299 | 28.1% |
[ 5.0% - 5.5% ] 5.46% | 293 | 28.0% |
[ 5.5% - 6.0% ] 5.56% | 1,798 | 13.3% |
[ 5.5% - 6.0% ] 5.69% | 1,107 | 6.1% |
[ 6.0% - 6.5% ] 6.00% | 22,505 | 21.2% |
[ 6.0% - 6.5% ] 6.14% | 1,010 | 19.6% |
[ 6.0% - 6.5% ] 6.21% | 22,114 | 22.5% |
[ 6.0% - 6.5% ] 6.24% | 2,034 | 48.5% |
[ 6.5% - 7.0% ] 6.92% | 1,041 | 42.0% |
[ 7.0% - 7.5% ] 7.22% | 3,575 | 17.8% |
[ 11.5% - 12.0% ] 11.97% | 1,295 | 20.1% |