Ghanaian Married-couple Households
COMPARE
Ghanaian
Select to Compare
Married-couple Households
Ghanaian Married-couple Households
42.2%
MARRIED-COUPLE HOUSEHOLDS
0.0/ 100
METRIC RATING
285th/ 347
METRIC RANK
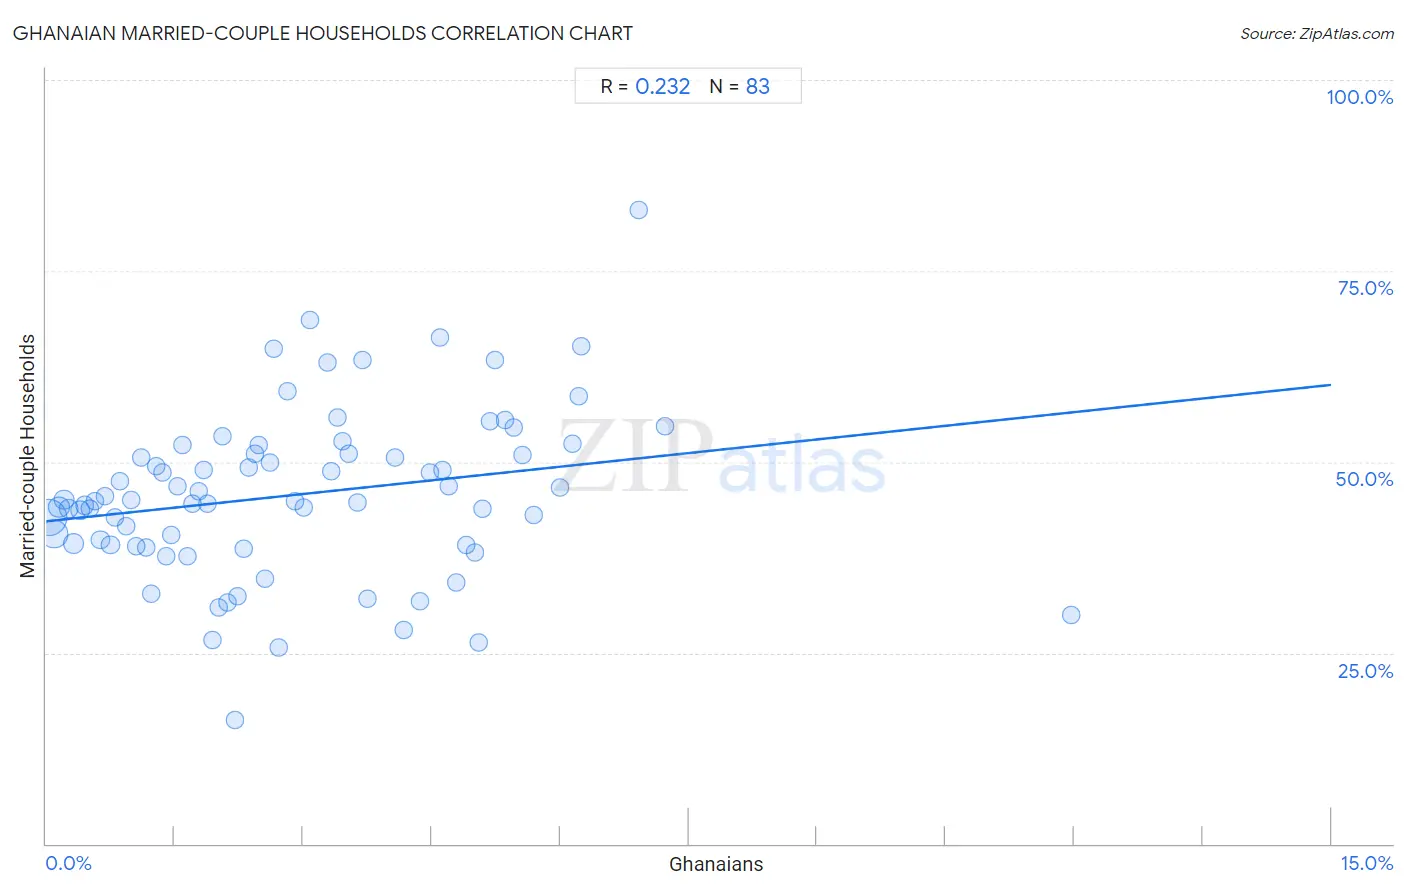
Ghanaian Married-couple Households Correlation Chart
The statistical analysis conducted on geographies consisting of 190,506,796 people shows a weak positive correlation between the proportion of Ghanaians and percentage of married-couple family households in the United States with a correlation coefficient (R) of 0.232 and weighted average of 42.2%. On average, for every 1% (one percent) increase in Ghanaians within a typical geography, there is an increase of 1.2% in percentage of married-couple family households.
It is essential to understand that the correlation between the percentage of Ghanaians and percentage of married-couple family households does not imply a direct cause-and-effect relationship. It remains uncertain whether the presence of Ghanaians influences an upward or downward trend in the level of percentage of married-couple family households within an area, or if Ghanaians simply ended up residing in those areas with higher or lower levels of percentage of married-couple family households due to other factors.
Demographics Similar to Ghanaians by Married-couple Households
In terms of married-couple households, the demographic groups most similar to Ghanaians are Belizean (42.2%, a difference of 0.010%), Cheyenne (42.3%, a difference of 0.030%), Chippewa (42.1%, a difference of 0.25%), Immigrants from Eritrea (42.1%, a difference of 0.33%), and Sudanese (42.1%, a difference of 0.38%).
| Demographics | Rating | Rank | Married-couple Households |
| Immigrants from Africa | 0.0 /100 | #278 | Tragic 42.9% |
| Sierra Leoneans | 0.0 /100 | #279 | Tragic 42.9% |
| Immigrants from Ecuador | 0.0 /100 | #280 | Tragic 42.9% |
| Immigrants from Guatemala | 0.0 /100 | #281 | Tragic 42.8% |
| Bermudans | 0.0 /100 | #282 | Tragic 42.4% |
| Inupiat | 0.0 /100 | #283 | Tragic 42.4% |
| Cheyenne | 0.0 /100 | #284 | Tragic 42.3% |
| Ghanaians | 0.0 /100 | #285 | Tragic 42.2% |
| Belizeans | 0.0 /100 | #286 | Tragic 42.2% |
| Chippewa | 0.0 /100 | #287 | Tragic 42.1% |
| Immigrants from Eritrea | 0.0 /100 | #288 | Tragic 42.1% |
| Sudanese | 0.0 /100 | #289 | Tragic 42.1% |
| Hondurans | 0.0 /100 | #290 | Tragic 42.1% |
| Paiute | 0.0 /100 | #291 | Tragic 42.1% |
| Indonesians | 0.0 /100 | #292 | Tragic 42.0% |
Ghanaian Married-couple Households Correlation Summary
| Measurement | Ghanaian Data | Married-couple Households Data |
| Minimum | 0.028% | 16.2% |
| Maximum | 12.0% | 82.9% |
| Range | 11.9% | 66.7% |
| Mean | 2.9% | 45.7% |
| Median | 2.5% | 44.9% |
| Interquartile 25% (IQ1) | 1.2% | 39.1% |
| Interquartile 75% (IQ3) | 4.6% | 51.1% |
| Interquartile Range (IQR) | 3.4% | 12.0% |
| Standard Deviation (Sample) | 2.1% | 11.0% |
| Standard Deviation (Population) | 2.1% | 10.9% |
Correlation Details
| Ghanaian Percentile | Sample Size | Married-couple Households |
[ 0.0% - 0.5% ] 0.028% | 84,693,809 | 42.8% |
[ 0.0% - 0.5% ] 0.088% | 42,452,023 | 40.5% |
[ 0.0% - 0.5% ] 0.15% | 14,957,459 | 44.1% |
[ 0.0% - 0.5% ] 0.21% | 8,599,566 | 45.0% |
[ 0.0% - 0.5% ] 0.27% | 6,197,989 | 43.9% |
[ 0.0% - 0.5% ] 0.32% | 12,762,071 | 39.3% |
[ 0.0% - 0.5% ] 0.39% | 3,380,952 | 43.7% |
[ 0.0% - 0.5% ] 0.45% | 2,803,245 | 44.3% |
[ 0.5% - 1.0% ] 0.51% | 1,741,571 | 43.9% |
[ 0.5% - 1.0% ] 0.57% | 1,311,289 | 44.9% |
[ 0.5% - 1.0% ] 0.63% | 1,987,905 | 39.8% |
[ 0.5% - 1.0% ] 0.68% | 798,820 | 45.6% |
[ 0.5% - 1.0% ] 0.75% | 1,419,113 | 39.1% |
[ 0.5% - 1.0% ] 0.80% | 666,045 | 42.8% |
[ 0.5% - 1.0% ] 0.87% | 530,607 | 47.4% |
[ 0.5% - 1.0% ] 0.93% | 447,036 | 41.6% |
[ 0.5% - 1.0% ] 0.99% | 368,827 | 45.0% |
[ 1.0% - 1.5% ] 1.05% | 567,076 | 39.0% |
[ 1.0% - 1.5% ] 1.10% | 231,909 | 50.6% |
[ 1.0% - 1.5% ] 1.17% | 321,189 | 38.8% |
[ 1.0% - 1.5% ] 1.22% | 311,825 | 32.8% |
[ 1.0% - 1.5% ] 1.28% | 443,712 | 49.4% |
[ 1.0% - 1.5% ] 1.35% | 191,762 | 48.5% |
[ 1.0% - 1.5% ] 1.40% | 339,224 | 37.6% |
[ 1.0% - 1.5% ] 1.46% | 230,746 | 40.4% |
[ 1.5% - 2.0% ] 1.53% | 62,787 | 46.8% |
[ 1.5% - 2.0% ] 1.58% | 193,038 | 52.2% |
[ 1.5% - 2.0% ] 1.65% | 209,236 | 37.6% |
[ 1.5% - 2.0% ] 1.71% | 115,620 | 44.5% |
[ 1.5% - 2.0% ] 1.78% | 74,718 | 46.2% |
[ 1.5% - 2.0% ] 1.84% | 252,368 | 48.9% |
[ 1.5% - 2.0% ] 1.88% | 280,228 | 44.6% |
[ 1.5% - 2.0% ] 1.94% | 74,483 | 26.8% |
[ 2.0% - 2.5% ] 2.02% | 125,871 | 30.9% |
[ 2.0% - 2.5% ] 2.06% | 80,818 | 53.4% |
[ 2.0% - 2.5% ] 2.12% | 118,697 | 31.6% |
[ 2.0% - 2.5% ] 2.20% | 1,999 | 16.2% |
[ 2.0% - 2.5% ] 2.23% | 14,296 | 32.4% |
[ 2.0% - 2.5% ] 2.31% | 36,119 | 38.6% |
[ 2.0% - 2.5% ] 2.37% | 38,913 | 49.2% |
[ 2.0% - 2.5% ] 2.44% | 84,672 | 51.1% |
[ 2.0% - 2.5% ] 2.49% | 6,916 | 52.2% |
[ 2.5% - 3.0% ] 2.55% | 231,804 | 34.7% |
[ 2.5% - 3.0% ] 2.61% | 16,183 | 49.9% |
[ 2.5% - 3.0% ] 2.66% | 6,773 | 64.8% |
[ 2.5% - 3.0% ] 2.72% | 181,389 | 25.7% |
[ 2.5% - 3.0% ] 2.81% | 13,927 | 59.2% |
[ 2.5% - 3.0% ] 2.91% | 9,389 | 44.8% |
[ 3.0% - 3.5% ] 3.01% | 47,793 | 44.0% |
[ 3.0% - 3.5% ] 3.08% | 3,638 | 68.6% |
[ 3.0% - 3.5% ] 3.28% | 22,049 | 63.1% |
[ 3.0% - 3.5% ] 3.33% | 38,632 | 48.7% |
[ 3.0% - 3.5% ] 3.40% | 19,605 | 55.9% |
[ 3.0% - 3.5% ] 3.46% | 1,705 | 52.7% |
[ 3.5% - 4.0% ] 3.52% | 36,265 | 51.1% |
[ 3.5% - 4.0% ] 3.64% | 22,966 | 44.7% |
[ 3.5% - 4.0% ] 3.70% | 703 | 63.3% |
[ 3.5% - 4.0% ] 3.75% | 55,168 | 32.0% |
[ 4.0% - 4.5% ] 4.08% | 19,938 | 50.6% |
[ 4.0% - 4.5% ] 4.17% | 30,590 | 28.0% |
[ 4.0% - 4.5% ] 4.37% | 229 | 31.7% |
[ 4.0% - 4.5% ] 4.47% | 72,215 | 48.6% |
[ 4.5% - 5.0% ] 4.60% | 630 | 66.4% |
[ 4.5% - 5.0% ] 4.63% | 3,135 | 49.0% |
[ 4.5% - 5.0% ] 4.70% | 2,721 | 46.9% |
[ 4.5% - 5.0% ] 4.79% | 376 | 34.3% |
[ 4.5% - 5.0% ] 4.91% | 23,110 | 39.1% |
[ 5.0% - 5.5% ] 5.01% | 43,231 | 38.1% |
[ 5.0% - 5.5% ] 5.05% | 297 | 26.3% |
[ 5.0% - 5.5% ] 5.09% | 2,474 | 43.8% |
[ 5.0% - 5.5% ] 5.18% | 733 | 55.3% |
[ 5.0% - 5.5% ] 5.24% | 15,508 | 63.3% |
[ 5.0% - 5.5% ] 5.35% | 299 | 55.5% |
[ 5.0% - 5.5% ] 5.46% | 293 | 54.5% |
[ 5.5% - 6.0% ] 5.56% | 1,798 | 50.9% |
[ 5.5% - 6.0% ] 5.69% | 1,107 | 43.1% |
[ 6.0% - 6.5% ] 6.00% | 22,505 | 46.6% |
[ 6.0% - 6.5% ] 6.14% | 1,010 | 52.4% |
[ 6.0% - 6.5% ] 6.21% | 22,114 | 58.6% |
[ 6.0% - 6.5% ] 6.24% | 2,034 | 65.2% |
[ 6.5% - 7.0% ] 6.92% | 1,041 | 82.9% |
[ 7.0% - 7.5% ] 7.22% | 3,575 | 54.6% |
[ 11.5% - 12.0% ] 11.97% | 1,295 | 30.0% |