Ghanaian Disability
COMPARE
Ghanaian
Select to Compare
Disability
Ghanaian Disability
11.5%
DISABILITY
87.0/ 100
METRIC RATING
139th/ 347
METRIC RANK
Ghanaian Disability Correlation Chart
The statistical analysis conducted on geographies consisting of 190,707,236 people shows a slight positive correlation between the proportion of Ghanaians and percentage of population with a disability in the United States with a correlation coefficient (R) of 0.057 and weighted average of 11.5%. On average, for every 1% (one percent) increase in Ghanaians within a typical geography, there is an increase of 0.11% in percentage of population with a disability.
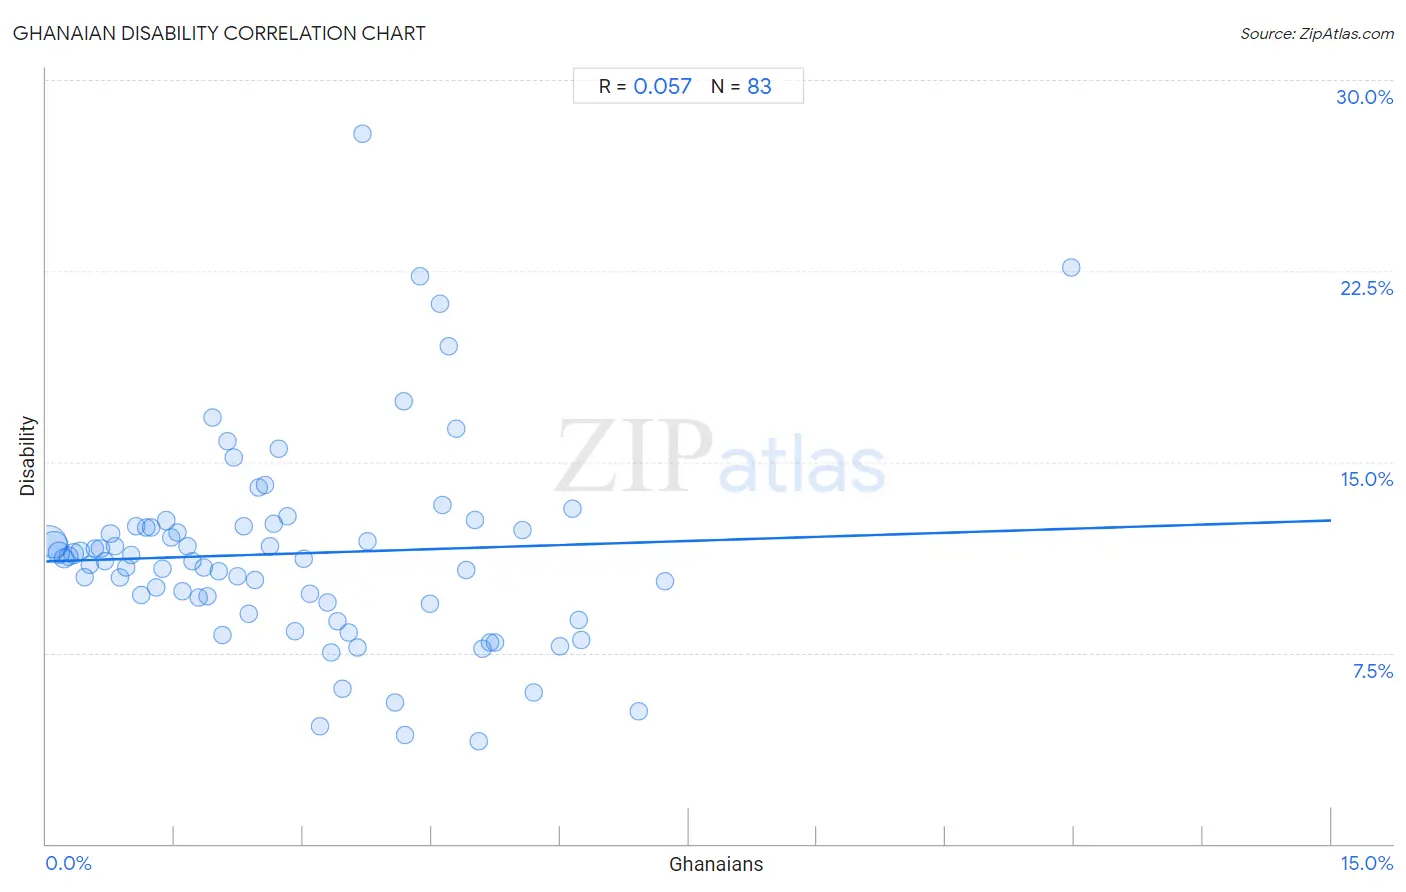
It is essential to understand that the correlation between the percentage of Ghanaians and percentage of population with a disability does not imply a direct cause-and-effect relationship. It remains uncertain whether the presence of Ghanaians influences an upward or downward trend in the level of percentage of population with a disability within an area, or if Ghanaians simply ended up residing in those areas with higher or lower levels of percentage of population with a disability due to other factors.
Demographics Similar to Ghanaians by Disability
In terms of disability, the demographic groups most similar to Ghanaians are New Zealander (11.5%, a difference of 0.0%), Kenyan (11.5%, a difference of 0.010%), Russian (11.5%, a difference of 0.020%), Immigrants from St. Vincent and the Grenadines (11.4%, a difference of 0.080%), and Immigrants from Grenada (11.5%, a difference of 0.080%).
| Demographics | Rating | Rank | Disability |
| Immigrants from Africa | 89.3 /100 | #132 | Excellent 11.4% |
| Arabs | 89.1 /100 | #133 | Excellent 11.4% |
| Immigrants from Guyana | 88.3 /100 | #134 | Excellent 11.4% |
| Ugandans | 87.9 /100 | #135 | Excellent 11.4% |
| Immigrants from St. Vincent and the Grenadines | 87.8 /100 | #136 | Excellent 11.4% |
| Kenyans | 87.1 /100 | #137 | Excellent 11.5% |
| New Zealanders | 87.0 /100 | #138 | Excellent 11.5% |
| Ghanaians | 87.0 /100 | #139 | Excellent 11.5% |
| Russians | 86.8 /100 | #140 | Excellent 11.5% |
| Immigrants from Grenada | 86.1 /100 | #141 | Excellent 11.5% |
| Immigrants from Sudan | 85.3 /100 | #142 | Excellent 11.5% |
| Moroccans | 83.3 /100 | #143 | Excellent 11.5% |
| Australians | 82.5 /100 | #144 | Excellent 11.5% |
| Nigerians | 81.3 /100 | #145 | Excellent 11.5% |
| Immigrants from Hungary | 79.0 /100 | #146 | Good 11.5% |
Ghanaian Disability Correlation Summary
| Measurement | Ghanaian Data | Disability Data |
| Minimum | 0.028% | 4.0% |
| Maximum | 12.0% | 27.9% |
| Range | 11.9% | 23.8% |
| Mean | 2.9% | 11.4% |
| Median | 2.5% | 11.2% |
| Interquartile 25% (IQ1) | 1.2% | 9.4% |
| Interquartile 75% (IQ3) | 4.4% | 12.5% |
| Interquartile Range (IQR) | 3.1% | 3.0% |
| Standard Deviation (Sample) | 2.1% | 4.0% |
| Standard Deviation (Population) | 2.1% | 4.0% |
Correlation Details
| Ghanaian Percentile | Sample Size | Disability |
[ 0.0% - 0.5% ] 0.028% | 84,693,809 | 11.8% |
[ 0.0% - 0.5% ] 0.088% | 42,475,821 | 11.7% |
[ 0.0% - 0.5% ] 0.15% | 15,007,399 | 11.4% |
[ 0.0% - 0.5% ] 0.21% | 8,623,503 | 11.2% |
[ 0.0% - 0.5% ] 0.27% | 6,209,781 | 11.3% |
[ 0.0% - 0.5% ] 0.32% | 12,771,919 | 11.4% |
[ 0.0% - 0.5% ] 0.39% | 3,389,358 | 11.5% |
[ 0.0% - 0.5% ] 0.45% | 2,807,979 | 10.5% |
[ 0.5% - 1.0% ] 0.51% | 1,750,776 | 10.9% |
[ 0.5% - 1.0% ] 0.57% | 1,312,558 | 11.6% |
[ 0.5% - 1.0% ] 0.63% | 1,995,893 | 11.6% |
[ 0.5% - 1.0% ] 0.68% | 803,629 | 11.1% |
[ 0.5% - 1.0% ] 0.75% | 1,424,240 | 12.2% |
[ 0.5% - 1.0% ] 0.80% | 670,209 | 11.7% |
[ 0.5% - 1.0% ] 0.87% | 530,607 | 10.5% |
[ 0.5% - 1.0% ] 0.93% | 450,837 | 10.9% |
[ 0.5% - 1.0% ] 0.99% | 370,267 | 11.4% |
[ 1.0% - 1.5% ] 1.05% | 567,076 | 12.5% |
[ 1.0% - 1.5% ] 1.10% | 231,909 | 9.8% |
[ 1.0% - 1.5% ] 1.17% | 321,189 | 12.4% |
[ 1.0% - 1.5% ] 1.22% | 323,918 | 12.4% |
[ 1.0% - 1.5% ] 1.28% | 443,712 | 10.1% |
[ 1.0% - 1.5% ] 1.35% | 191,762 | 10.8% |
[ 1.0% - 1.5% ] 1.40% | 339,224 | 12.7% |
[ 1.0% - 1.5% ] 1.46% | 232,886 | 12.0% |
[ 1.5% - 2.0% ] 1.53% | 62,787 | 12.2% |
[ 1.5% - 2.0% ] 1.58% | 193,038 | 9.9% |
[ 1.5% - 2.0% ] 1.65% | 209,236 | 11.7% |
[ 1.5% - 2.0% ] 1.71% | 115,620 | 11.1% |
[ 1.5% - 2.0% ] 1.78% | 77,677 | 9.6% |
[ 1.5% - 2.0% ] 1.84% | 252,368 | 10.8% |
[ 1.5% - 2.0% ] 1.88% | 280,547 | 9.7% |
[ 1.5% - 2.0% ] 1.94% | 75,155 | 16.7% |
[ 2.0% - 2.5% ] 2.02% | 126,465 | 10.7% |
[ 2.0% - 2.5% ] 2.06% | 85,128 | 8.2% |
[ 2.0% - 2.5% ] 2.12% | 118,697 | 15.8% |
[ 2.0% - 2.5% ] 2.19% | 3,424 | 15.2% |
[ 2.0% - 2.5% ] 2.23% | 14,296 | 10.5% |
[ 2.0% - 2.5% ] 2.31% | 36,119 | 12.5% |
[ 2.0% - 2.5% ] 2.37% | 38,913 | 9.0% |
[ 2.0% - 2.5% ] 2.44% | 84,672 | 10.4% |
[ 2.0% - 2.5% ] 2.49% | 6,916 | 14.0% |
[ 2.5% - 3.0% ] 2.55% | 232,392 | 14.1% |
[ 2.5% - 3.0% ] 2.61% | 16,183 | 11.7% |
[ 2.5% - 3.0% ] 2.66% | 6,773 | 12.6% |
[ 2.5% - 3.0% ] 2.72% | 181,389 | 15.5% |
[ 2.5% - 3.0% ] 2.81% | 13,927 | 12.9% |
[ 2.5% - 3.0% ] 2.91% | 9,389 | 8.3% |
[ 3.0% - 3.5% ] 3.01% | 47,793 | 11.2% |
[ 3.0% - 3.5% ] 3.08% | 3,638 | 9.8% |
[ 3.0% - 3.5% ] 3.19% | 2,694 | 4.6% |
[ 3.0% - 3.5% ] 3.28% | 22,049 | 9.5% |
[ 3.0% - 3.5% ] 3.33% | 38,632 | 7.5% |
[ 3.0% - 3.5% ] 3.40% | 19,605 | 8.7% |
[ 3.0% - 3.5% ] 3.46% | 1,705 | 6.1% |
[ 3.5% - 4.0% ] 3.52% | 36,265 | 8.3% |
[ 3.5% - 4.0% ] 3.64% | 22,966 | 7.7% |
[ 3.5% - 4.0% ] 3.70% | 703 | 27.9% |
[ 3.5% - 4.0% ] 3.75% | 55,168 | 11.9% |
[ 4.0% - 4.5% ] 4.08% | 19,938 | 5.6% |
[ 4.0% - 4.5% ] 4.17% | 30,590 | 17.4% |
[ 4.0% - 4.5% ] 4.19% | 2,980 | 4.3% |
[ 4.0% - 4.5% ] 4.37% | 229 | 22.3% |
[ 4.0% - 4.5% ] 4.47% | 72,215 | 9.4% |
[ 4.5% - 5.0% ] 4.60% | 630 | 21.2% |
[ 4.5% - 5.0% ] 4.63% | 3,135 | 13.3% |
[ 4.5% - 5.0% ] 4.70% | 2,721 | 19.6% |
[ 4.5% - 5.0% ] 4.79% | 376 | 16.3% |
[ 4.5% - 5.0% ] 4.91% | 23,110 | 10.8% |
[ 5.0% - 5.5% ] 5.01% | 43,231 | 12.7% |
[ 5.0% - 5.5% ] 5.05% | 297 | 4.0% |
[ 5.0% - 5.5% ] 5.09% | 2,474 | 7.7% |
[ 5.0% - 5.5% ] 5.18% | 733 | 7.9% |
[ 5.0% - 5.5% ] 5.24% | 15,508 | 7.9% |
[ 5.5% - 6.0% ] 5.56% | 1,798 | 12.3% |
[ 5.5% - 6.0% ] 5.69% | 1,107 | 6.0% |
[ 6.0% - 6.5% ] 6.00% | 22,505 | 7.8% |
[ 6.0% - 6.5% ] 6.14% | 1,010 | 13.2% |
[ 6.0% - 6.5% ] 6.21% | 22,114 | 8.8% |
[ 6.0% - 6.5% ] 6.24% | 2,034 | 8.0% |
[ 6.5% - 7.0% ] 6.92% | 1,041 | 5.2% |
[ 7.0% - 7.5% ] 7.22% | 3,575 | 10.3% |
[ 11.5% - 12.0% ] 11.97% | 1,295 | 22.6% |