Ghanaian Self-Care Disability
COMPARE
Ghanaian
Select to Compare
Self-Care Disability
Ghanaian Self-Care Disability
2.5%
SELF-CARE DISABILITY
40.4/ 100
METRIC RATING
181st/ 347
METRIC RANK
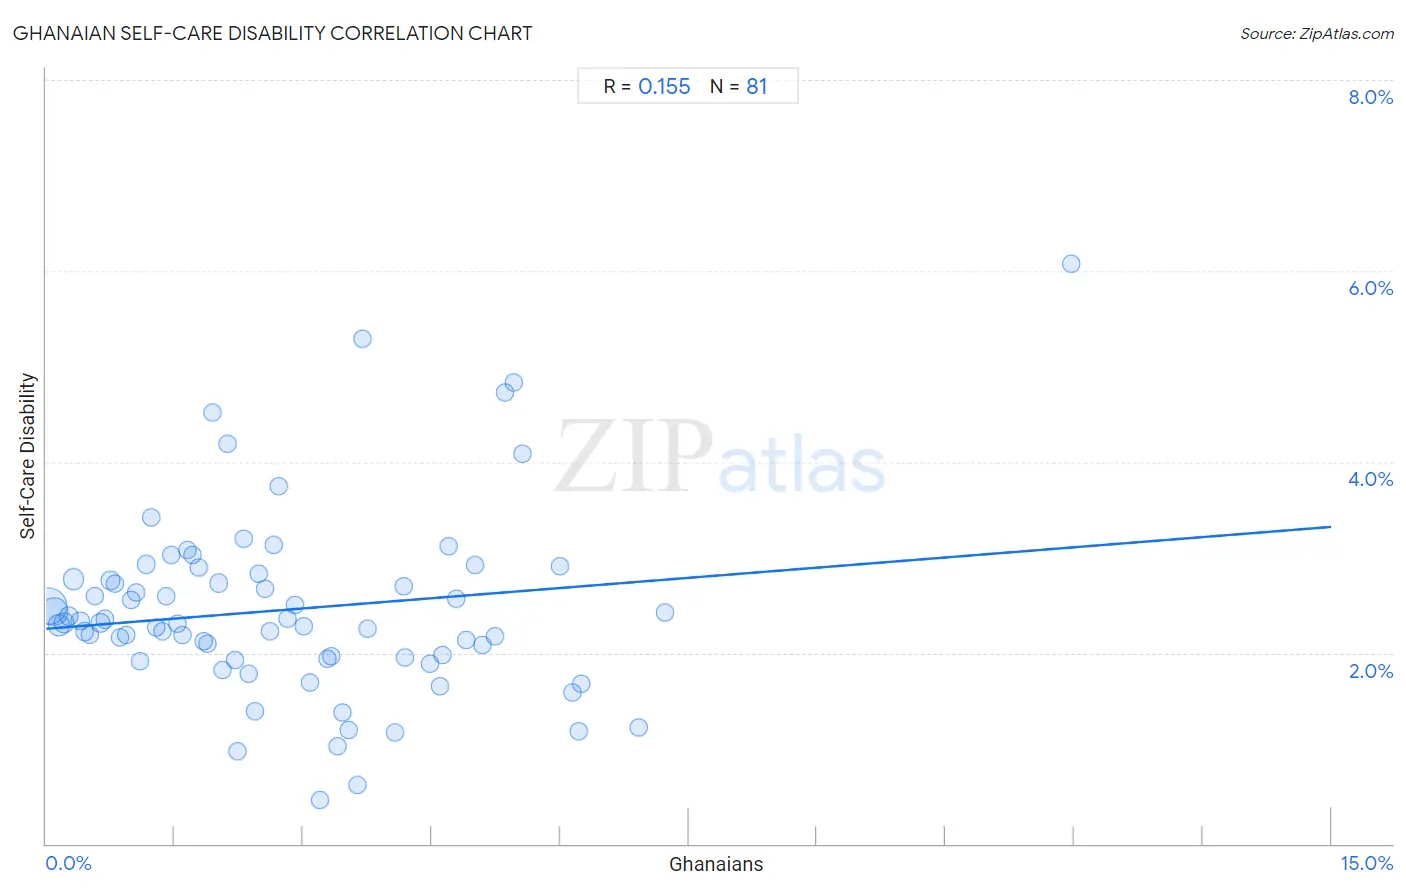
Ghanaian Self-Care Disability Correlation Chart
The statistical analysis conducted on geographies consisting of 190,499,518 people shows a poor positive correlation between the proportion of Ghanaians and percentage of population with self-care disability in the United States with a correlation coefficient (R) of 0.155 and weighted average of 2.5%. On average, for every 1% (one percent) increase in Ghanaians within a typical geography, there is an increase of 0.071% in percentage of population with self-care disability.
It is essential to understand that the correlation between the percentage of Ghanaians and percentage of population with self-care disability does not imply a direct cause-and-effect relationship. It remains uncertain whether the presence of Ghanaians influences an upward or downward trend in the level of percentage of population with self-care disability within an area, or if Ghanaians simply ended up residing in those areas with higher or lower levels of percentage of population with self-care disability due to other factors.
Demographics Similar to Ghanaians by Self-Care Disability
In terms of self-care disability, the demographic groups most similar to Ghanaians are Indonesian (2.5%, a difference of 0.040%), Maltese (2.5%, a difference of 0.14%), Salvadoran (2.5%, a difference of 0.20%), Yugoslavian (2.5%, a difference of 0.21%), and Hungarian (2.5%, a difference of 0.25%).
| Demographics | Rating | Rank | Self-Care Disability |
| Welsh | 50.0 /100 | #174 | Average 2.5% |
| Immigrants from Bosnia and Herzegovina | 49.6 /100 | #175 | Average 2.5% |
| Immigrants from Afghanistan | 47.6 /100 | #176 | Average 2.5% |
| Immigrants from Kazakhstan | 46.7 /100 | #177 | Average 2.5% |
| English | 46.2 /100 | #178 | Average 2.5% |
| Hungarians | 45.5 /100 | #179 | Average 2.5% |
| Indonesians | 41.2 /100 | #180 | Average 2.5% |
| Ghanaians | 40.4 /100 | #181 | Average 2.5% |
| Maltese | 37.5 /100 | #182 | Fair 2.5% |
| Salvadorans | 36.4 /100 | #183 | Fair 2.5% |
| Yugoslavians | 36.1 /100 | #184 | Fair 2.5% |
| Slavs | 34.3 /100 | #185 | Fair 2.5% |
| Immigrants from El Salvador | 33.0 /100 | #186 | Fair 2.5% |
| Irish | 28.7 /100 | #187 | Fair 2.5% |
| Immigrants from Oceania | 28.3 /100 | #188 | Fair 2.5% |
Ghanaian Self-Care Disability Correlation Summary
| Measurement | Ghanaian Data | Self-Care Disability Data |
| Minimum | 0.028% | 0.46% |
| Maximum | 12.0% | 6.1% |
| Range | 11.9% | 5.6% |
| Mean | 2.8% | 2.5% |
| Median | 2.4% | 2.3% |
| Interquartile 25% (IQ1) | 1.2% | 1.9% |
| Interquartile 75% (IQ3) | 4.2% | 2.8% |
| Interquartile Range (IQR) | 3.0% | 0.86% |
| Standard Deviation (Sample) | 2.1% | 0.97% |
| Standard Deviation (Population) | 2.1% | 0.97% |
Correlation Details
| Ghanaian Percentile | Sample Size | Self-Care Disability |
[ 0.0% - 0.5% ] 0.028% | 84,681,820 | 2.5% |
[ 0.0% - 0.5% ] 0.088% | 42,461,396 | 2.4% |
[ 0.0% - 0.5% ] 0.15% | 14,960,209 | 2.3% |
[ 0.0% - 0.5% ] 0.21% | 8,613,415 | 2.3% |
[ 0.0% - 0.5% ] 0.27% | 6,194,867 | 2.4% |
[ 0.0% - 0.5% ] 0.32% | 12,763,414 | 2.8% |
[ 0.0% - 0.5% ] 0.39% | 3,380,952 | 2.3% |
[ 0.0% - 0.5% ] 0.45% | 2,795,450 | 2.2% |
[ 0.5% - 1.0% ] 0.51% | 1,730,816 | 2.2% |
[ 0.5% - 1.0% ] 0.57% | 1,311,289 | 2.6% |
[ 0.5% - 1.0% ] 0.63% | 1,986,210 | 2.3% |
[ 0.5% - 1.0% ] 0.68% | 803,629 | 2.4% |
[ 0.5% - 1.0% ] 0.75% | 1,420,214 | 2.8% |
[ 0.5% - 1.0% ] 0.80% | 666,045 | 2.7% |
[ 0.5% - 1.0% ] 0.87% | 530,607 | 2.2% |
[ 0.5% - 1.0% ] 0.93% | 447,036 | 2.2% |
[ 0.5% - 1.0% ] 0.99% | 370,267 | 2.6% |
[ 1.0% - 1.5% ] 1.05% | 567,076 | 2.6% |
[ 1.0% - 1.5% ] 1.10% | 225,551 | 1.9% |
[ 1.0% - 1.5% ] 1.17% | 321,189 | 2.9% |
[ 1.0% - 1.5% ] 1.22% | 320,580 | 3.4% |
[ 1.0% - 1.5% ] 1.28% | 440,940 | 2.3% |
[ 1.0% - 1.5% ] 1.35% | 190,514 | 2.2% |
[ 1.0% - 1.5% ] 1.40% | 339,224 | 2.6% |
[ 1.0% - 1.5% ] 1.46% | 227,751 | 3.0% |
[ 1.5% - 2.0% ] 1.53% | 62,787 | 2.3% |
[ 1.5% - 2.0% ] 1.58% | 188,095 | 2.2% |
[ 1.5% - 2.0% ] 1.65% | 204,578 | 3.1% |
[ 1.5% - 2.0% ] 1.71% | 115,620 | 3.0% |
[ 1.5% - 2.0% ] 1.78% | 74,718 | 2.9% |
[ 1.5% - 2.0% ] 1.84% | 252,368 | 2.1% |
[ 1.5% - 2.0% ] 1.88% | 280,228 | 2.1% |
[ 1.5% - 2.0% ] 1.94% | 75,155 | 4.5% |
[ 2.0% - 2.5% ] 2.02% | 125,871 | 2.7% |
[ 2.0% - 2.5% ] 2.06% | 85,128 | 1.8% |
[ 2.0% - 2.5% ] 2.12% | 118,697 | 4.2% |
[ 2.0% - 2.5% ] 2.20% | 1,999 | 1.9% |
[ 2.0% - 2.5% ] 2.23% | 14,296 | 0.97% |
[ 2.0% - 2.5% ] 2.31% | 36,119 | 3.2% |
[ 2.0% - 2.5% ] 2.37% | 38,913 | 1.8% |
[ 2.0% - 2.5% ] 2.44% | 84,014 | 1.4% |
[ 2.0% - 2.5% ] 2.49% | 6,916 | 2.8% |
[ 2.5% - 3.0% ] 2.55% | 231,804 | 2.7% |
[ 2.5% - 3.0% ] 2.61% | 16,183 | 2.2% |
[ 2.5% - 3.0% ] 2.66% | 6,773 | 3.1% |
[ 2.5% - 3.0% ] 2.72% | 181,389 | 3.7% |
[ 2.5% - 3.0% ] 2.81% | 13,927 | 2.4% |
[ 2.5% - 3.0% ] 2.91% | 9,389 | 2.5% |
[ 3.0% - 3.5% ] 3.01% | 47,793 | 2.3% |
[ 3.0% - 3.5% ] 3.08% | 3,638 | 1.7% |
[ 3.0% - 3.5% ] 3.19% | 2,694 | 0.46% |
[ 3.0% - 3.5% ] 3.28% | 22,049 | 1.9% |
[ 3.0% - 3.5% ] 3.33% | 38,632 | 2.0% |
[ 3.0% - 3.5% ] 3.40% | 19,605 | 1.0% |
[ 3.0% - 3.5% ] 3.46% | 1,705 | 1.4% |
[ 3.5% - 4.0% ] 3.52% | 36,265 | 1.2% |
[ 3.5% - 4.0% ] 3.64% | 22,966 | 0.62% |
[ 3.5% - 4.0% ] 3.70% | 703 | 5.3% |
[ 3.5% - 4.0% ] 3.75% | 55,168 | 2.2% |
[ 4.0% - 4.5% ] 4.08% | 19,938 | 1.2% |
[ 4.0% - 4.5% ] 4.17% | 30,590 | 2.7% |
[ 4.0% - 4.5% ] 4.19% | 2,980 | 2.0% |
[ 4.0% - 4.5% ] 4.47% | 72,215 | 1.9% |
[ 4.5% - 5.0% ] 4.60% | 630 | 1.6% |
[ 4.5% - 5.0% ] 4.63% | 3,135 | 2.0% |
[ 4.5% - 5.0% ] 4.70% | 2,721 | 3.1% |
[ 4.5% - 5.0% ] 4.79% | 376 | 2.6% |
[ 4.5% - 5.0% ] 4.91% | 23,110 | 2.1% |
[ 5.0% - 5.5% ] 5.01% | 43,231 | 2.9% |
[ 5.0% - 5.5% ] 5.09% | 2,474 | 2.1% |
[ 5.0% - 5.5% ] 5.24% | 15,508 | 2.2% |
[ 5.0% - 5.5% ] 5.35% | 299 | 4.7% |
[ 5.0% - 5.5% ] 5.46% | 293 | 4.8% |
[ 5.5% - 6.0% ] 5.56% | 1,798 | 4.1% |
[ 6.0% - 6.5% ] 6.00% | 22,505 | 2.9% |
[ 6.0% - 6.5% ] 6.14% | 1,010 | 1.6% |
[ 6.0% - 6.5% ] 6.21% | 22,114 | 1.2% |
[ 6.0% - 6.5% ] 6.24% | 2,034 | 1.7% |
[ 6.5% - 7.0% ] 6.92% | 1,041 | 1.2% |
[ 7.0% - 7.5% ] 7.22% | 3,575 | 2.4% |
[ 11.5% - 12.0% ] 11.97% | 1,295 | 6.1% |