Ghanaian Married-Couple Family Poverty
COMPARE
Ghanaian
Select to Compare
Married-Couple Family Poverty
Ghanaian Married-Couple Family Poverty
5.7%
POVERTY | MARRIED-COUPLE FAMILIES
3.3/ 100
METRIC RATING
236th/ 347
METRIC RANK
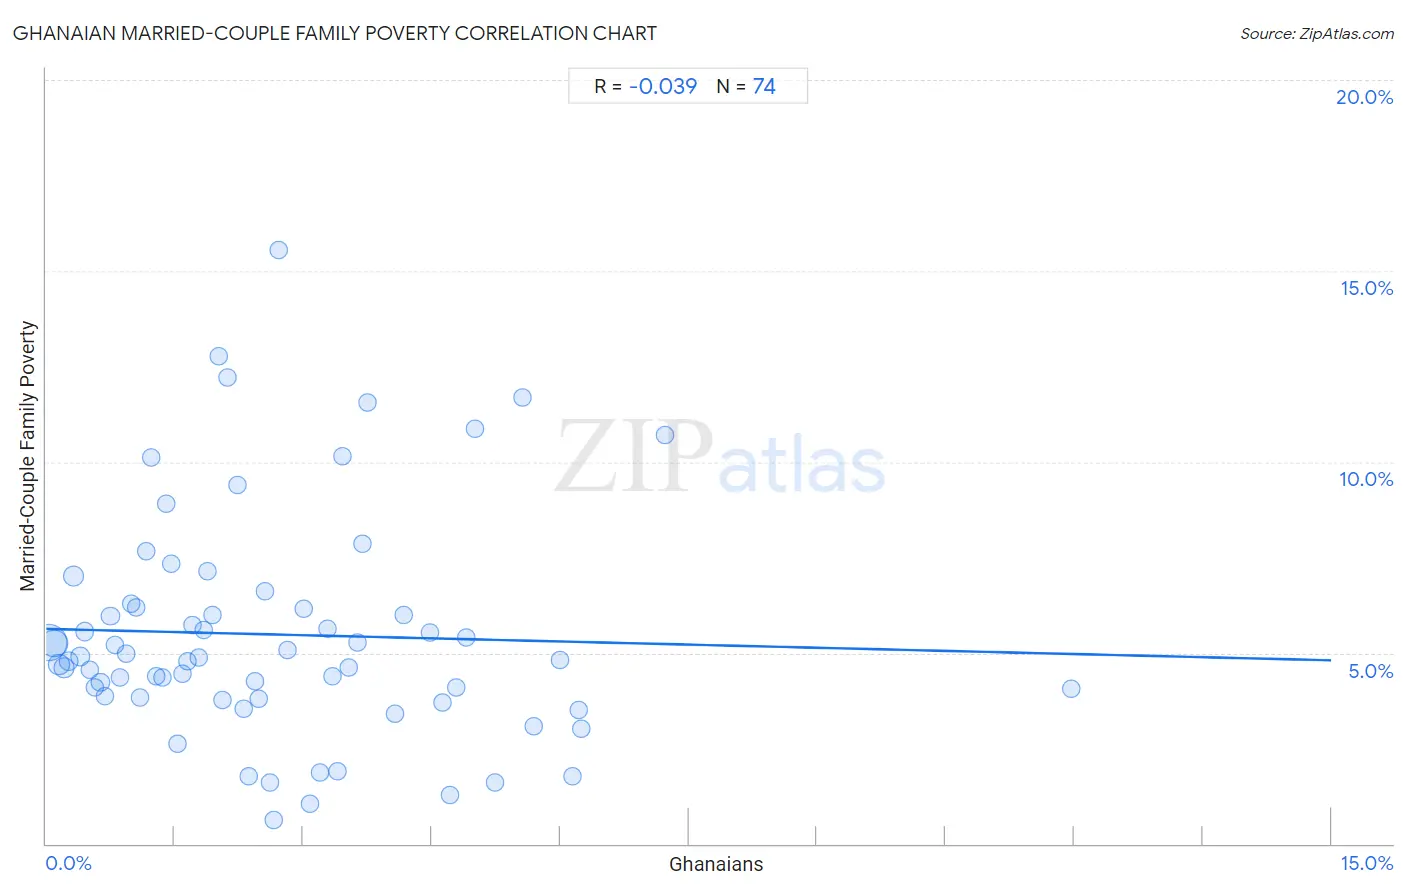
Ghanaian Married-Couple Family Poverty Correlation Chart
The statistical analysis conducted on geographies consisting of 189,762,764 people shows no correlation between the proportion of Ghanaians and poverty level among married-couple families in the United States with a correlation coefficient (R) of -0.039 and weighted average of 5.7%. On average, for every 1% (one percent) increase in Ghanaians within a typical geography, there is a decrease of 0.055% in poverty level among married-couple families.
It is essential to understand that the correlation between the percentage of Ghanaians and poverty level among married-couple families does not imply a direct cause-and-effect relationship. It remains uncertain whether the presence of Ghanaians influences an upward or downward trend in the level of poverty level among married-couple families within an area, or if Ghanaians simply ended up residing in those areas with higher or lower levels of poverty level among married-couple families due to other factors.
Demographics Similar to Ghanaians by Married-Couple Family Poverty
In terms of married-couple family poverty, the demographic groups most similar to Ghanaians are Immigrants from Sudan (5.7%, a difference of 0.16%), Immigrants from South America (5.7%, a difference of 0.16%), Immigrants from Colombia (5.7%, a difference of 0.35%), Immigrants from Uruguay (5.7%, a difference of 0.35%), and Cherokee (5.8%, a difference of 0.53%).
| Demographics | Rating | Rank | Married-Couple Family Poverty |
| Sub-Saharan Africans | 4.9 /100 | #229 | Tragic 5.7% |
| Moroccans | 4.9 /100 | #230 | Tragic 5.7% |
| Immigrants from Iraq | 4.4 /100 | #231 | Tragic 5.7% |
| Immigrants from Laos | 4.4 /100 | #232 | Tragic 5.7% |
| Immigrants from Colombia | 3.7 /100 | #233 | Tragic 5.7% |
| Immigrants from Uruguay | 3.7 /100 | #234 | Tragic 5.7% |
| Immigrants from Sudan | 3.5 /100 | #235 | Tragic 5.7% |
| Ghanaians | 3.3 /100 | #236 | Tragic 5.7% |
| Immigrants from South America | 3.1 /100 | #237 | Tragic 5.7% |
| Cherokee | 2.7 /100 | #238 | Tragic 5.8% |
| Venezuelans | 2.7 /100 | #239 | Tragic 5.8% |
| Fijians | 2.5 /100 | #240 | Tragic 5.8% |
| Immigrants from Panama | 2.5 /100 | #241 | Tragic 5.8% |
| Immigrants from Western Africa | 2.4 /100 | #242 | Tragic 5.8% |
| Somalis | 2.3 /100 | #243 | Tragic 5.8% |
Ghanaian Married-Couple Family Poverty Correlation Summary
| Measurement | Ghanaian Data | Married-Couple Family Poverty Data |
| Minimum | 0.028% | 0.61% |
| Maximum | 12.0% | 15.5% |
| Range | 11.9% | 14.9% |
| Mean | 2.7% | 5.5% |
| Median | 2.3% | 4.8% |
| Interquartile 25% (IQ1) | 1.1% | 3.8% |
| Interquartile 75% (IQ3) | 3.7% | 6.2% |
| Interquartile Range (IQR) | 2.6% | 2.4% |
| Standard Deviation (Sample) | 2.1% | 3.0% |
| Standard Deviation (Population) | 2.1% | 2.9% |
Correlation Details
| Ghanaian Percentile | Sample Size | Married-Couple Family Poverty |
[ 0.0% - 0.5% ] 0.028% | 84,599,058 | 5.3% |
[ 0.0% - 0.5% ] 0.088% | 42,351,287 | 5.2% |
[ 0.0% - 0.5% ] 0.15% | 14,912,091 | 4.7% |
[ 0.0% - 0.5% ] 0.21% | 8,574,666 | 4.6% |
[ 0.0% - 0.5% ] 0.27% | 6,164,327 | 4.8% |
[ 0.0% - 0.5% ] 0.32% | 12,735,722 | 7.0% |
[ 0.0% - 0.5% ] 0.39% | 3,326,891 | 4.9% |
[ 0.0% - 0.5% ] 0.45% | 2,779,129 | 5.6% |
[ 0.5% - 1.0% ] 0.51% | 1,710,966 | 4.6% |
[ 0.5% - 1.0% ] 0.57% | 1,296,032 | 4.1% |
[ 0.5% - 1.0% ] 0.63% | 1,969,552 | 4.2% |
[ 0.5% - 1.0% ] 0.68% | 788,337 | 3.9% |
[ 0.5% - 1.0% ] 0.75% | 1,418,175 | 6.0% |
[ 0.5% - 1.0% ] 0.80% | 650,531 | 5.2% |
[ 0.5% - 1.0% ] 0.87% | 530,607 | 4.4% |
[ 0.5% - 1.0% ] 0.93% | 442,593 | 5.0% |
[ 0.5% - 1.0% ] 0.99% | 354,113 | 6.3% |
[ 1.0% - 1.5% ] 1.05% | 567,076 | 6.2% |
[ 1.0% - 1.5% ] 1.10% | 203,219 | 3.8% |
[ 1.0% - 1.5% ] 1.17% | 277,202 | 7.7% |
[ 1.0% - 1.5% ] 1.22% | 309,546 | 10.1% |
[ 1.0% - 1.5% ] 1.28% | 418,413 | 4.4% |
[ 1.0% - 1.5% ] 1.35% | 183,173 | 4.4% |
[ 1.0% - 1.5% ] 1.40% | 339,224 | 8.9% |
[ 1.0% - 1.5% ] 1.46% | 218,639 | 7.3% |
[ 1.5% - 2.0% ] 1.53% | 62,787 | 2.6% |
[ 1.5% - 2.0% ] 1.58% | 180,309 | 4.4% |
[ 1.5% - 2.0% ] 1.65% | 200,679 | 4.8% |
[ 1.5% - 2.0% ] 1.71% | 115,620 | 5.7% |
[ 1.5% - 2.0% ] 1.78% | 74,718 | 4.9% |
[ 1.5% - 2.0% ] 1.84% | 252,368 | 5.6% |
[ 1.5% - 2.0% ] 1.88% | 280,228 | 7.1% |
[ 1.5% - 2.0% ] 1.94% | 74,483 | 6.0% |
[ 2.0% - 2.5% ] 2.02% | 116,802 | 12.8% |
[ 2.0% - 2.5% ] 2.06% | 73,455 | 3.7% |
[ 2.0% - 2.5% ] 2.12% | 96,466 | 12.2% |
[ 2.0% - 2.5% ] 2.23% | 14,296 | 9.4% |
[ 2.0% - 2.5% ] 2.31% | 34,141 | 3.5% |
[ 2.0% - 2.5% ] 2.36% | 25,540 | 1.8% |
[ 2.0% - 2.5% ] 2.44% | 84,014 | 4.2% |
[ 2.0% - 2.5% ] 2.49% | 6,916 | 3.8% |
[ 2.5% - 3.0% ] 2.55% | 231,804 | 6.6% |
[ 2.5% - 3.0% ] 2.61% | 16,183 | 1.6% |
[ 2.5% - 3.0% ] 2.66% | 6,773 | 0.61% |
[ 2.5% - 3.0% ] 2.72% | 181,389 | 15.5% |
[ 2.5% - 3.0% ] 2.81% | 13,927 | 5.1% |
[ 3.0% - 3.5% ] 3.01% | 47,793 | 6.2% |
[ 3.0% - 3.5% ] 3.08% | 3,638 | 1.1% |
[ 3.0% - 3.5% ] 3.19% | 2,694 | 1.9% |
[ 3.0% - 3.5% ] 3.28% | 22,049 | 5.6% |
[ 3.0% - 3.5% ] 3.34% | 29,919 | 4.4% |
[ 3.0% - 3.5% ] 3.40% | 19,605 | 1.9% |
[ 3.0% - 3.5% ] 3.46% | 1,705 | 10.1% |
[ 3.5% - 4.0% ] 3.52% | 36,265 | 4.6% |
[ 3.5% - 4.0% ] 3.64% | 22,966 | 5.3% |
[ 3.5% - 4.0% ] 3.70% | 703 | 7.9% |
[ 3.5% - 4.0% ] 3.75% | 55,168 | 11.6% |
[ 4.0% - 4.5% ] 4.08% | 19,938 | 3.4% |
[ 4.0% - 4.5% ] 4.17% | 30,590 | 6.0% |
[ 4.0% - 4.5% ] 4.47% | 72,215 | 5.5% |
[ 4.5% - 5.0% ] 4.62% | 2,770 | 3.7% |
[ 4.5% - 5.0% ] 4.71% | 1,315 | 1.3% |
[ 4.5% - 5.0% ] 4.79% | 376 | 4.1% |
[ 4.5% - 5.0% ] 4.91% | 23,110 | 5.4% |
[ 5.0% - 5.5% ] 5.01% | 40,724 | 10.9% |
[ 5.0% - 5.5% ] 5.23% | 10,316 | 1.6% |
[ 5.5% - 6.0% ] 5.56% | 1,798 | 11.7% |
[ 5.5% - 6.0% ] 5.69% | 1,107 | 3.1% |
[ 6.0% - 6.5% ] 6.00% | 22,505 | 4.8% |
[ 6.0% - 6.5% ] 6.14% | 1,010 | 1.8% |
[ 6.0% - 6.5% ] 6.21% | 22,114 | 3.5% |
[ 6.0% - 6.5% ] 6.24% | 2,034 | 3.0% |
[ 7.0% - 7.5% ] 7.22% | 3,575 | 10.7% |
[ 11.5% - 12.0% ] 11.97% | 1,295 | 4.1% |