Fijian College, Under 1 year
COMPARE
Fijian
Select to Compare
College, Under 1 year
Fijian College, Under 1 year
57.7%
COLLEGE, UNDER 1 YEAR
0.0/ 100
METRIC RATING
307th/ 347
METRIC RANK
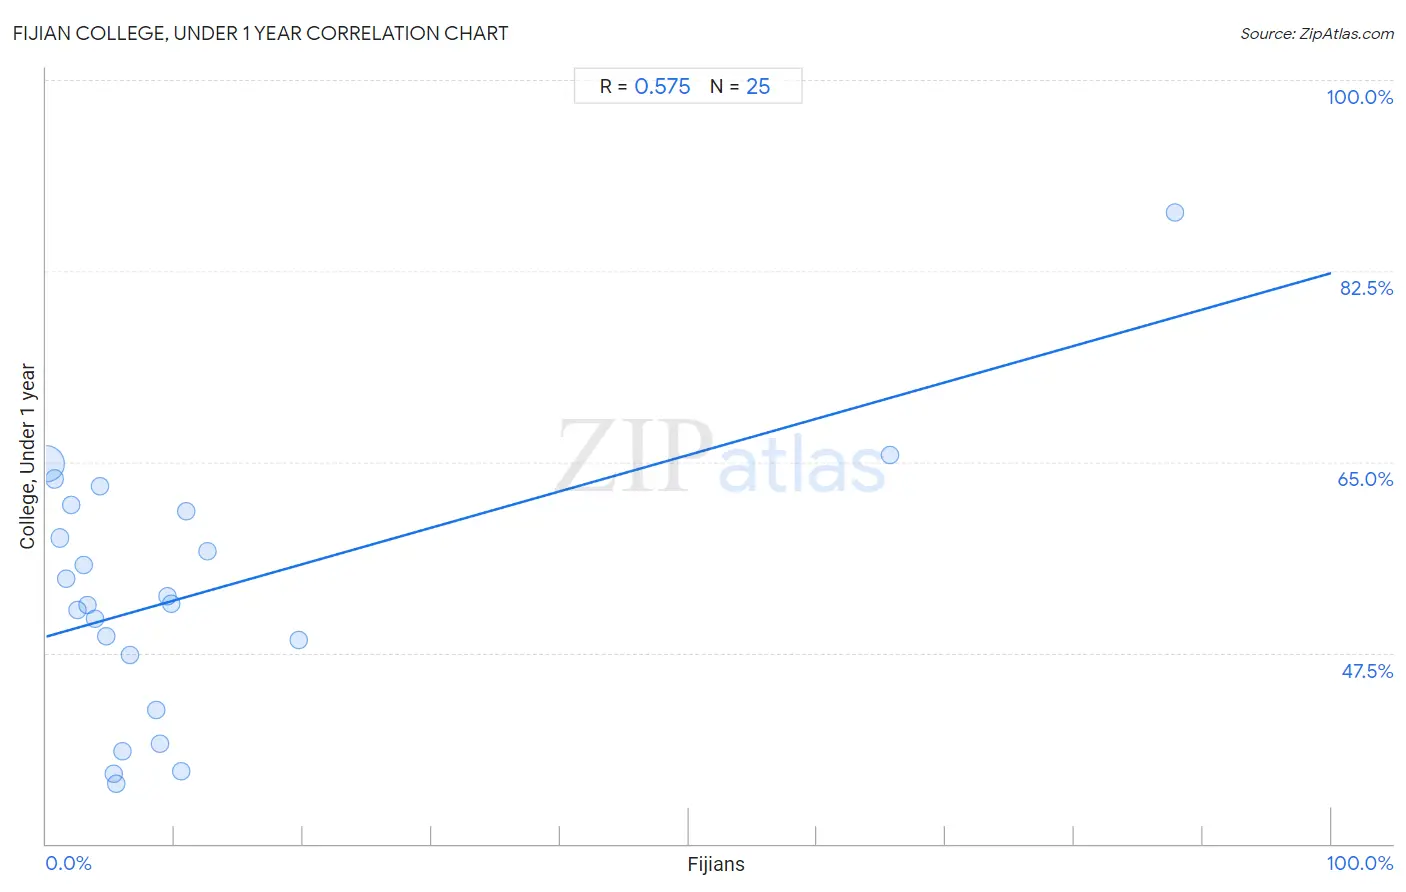
Fijian College, Under 1 year Correlation Chart
The statistical analysis conducted on geographies consisting of 55,948,842 people shows a substantial positive correlation between the proportion of Fijians and percentage of population with at least college, under 1 year education in the United States with a correlation coefficient (R) of 0.575 and weighted average of 57.7%. On average, for every 1% (one percent) increase in Fijians within a typical geography, there is an increase of 0.33% in percentage of population with at least college, under 1 year education.
It is essential to understand that the correlation between the percentage of Fijians and percentage of population with at least college, under 1 year education does not imply a direct cause-and-effect relationship. It remains uncertain whether the presence of Fijians influences an upward or downward trend in the level of percentage of population with at least college, under 1 year education within an area, or if Fijians simply ended up residing in those areas with higher or lower levels of percentage of population with at least college, under 1 year education due to other factors.
Demographics Similar to Fijians by College, Under 1 year
In terms of college, under 1 year, the demographic groups most similar to Fijians are Central American (57.7%, a difference of 0.0%), Immigrants from Portugal (57.7%, a difference of 0.010%), Immigrants from Nicaragua (57.6%, a difference of 0.12%), Haitian (57.8%, a difference of 0.21%), and Kiowa (57.8%, a difference of 0.32%).
| Demographics | Rating | Rank | College, Under 1 year |
| Immigrants from Guyana | 0.0 /100 | #300 | Tragic 58.5% |
| Mexican American Indians | 0.0 /100 | #301 | Tragic 58.1% |
| Apache | 0.0 /100 | #302 | Tragic 58.0% |
| Immigrants from Dominica | 0.0 /100 | #303 | Tragic 57.9% |
| Kiowa | 0.0 /100 | #304 | Tragic 57.8% |
| Haitians | 0.0 /100 | #305 | Tragic 57.8% |
| Immigrants from Portugal | 0.0 /100 | #306 | Tragic 57.7% |
| Fijians | 0.0 /100 | #307 | Tragic 57.7% |
| Central Americans | 0.0 /100 | #308 | Tragic 57.7% |
| Immigrants from Nicaragua | 0.0 /100 | #309 | Tragic 57.6% |
| Pueblo | 0.0 /100 | #310 | Tragic 57.4% |
| Cajuns | 0.0 /100 | #311 | Tragic 57.3% |
| Salvadorans | 0.0 /100 | #312 | Tragic 57.3% |
| Dutch West Indians | 0.0 /100 | #313 | Tragic 57.2% |
| Hopi | 0.0 /100 | #314 | Tragic 57.1% |
Fijian College, Under 1 year Correlation Summary
| Measurement | Fijian Data | College, Under 1 year Data |
| Minimum | 0.040% | 35.5% |
| Maximum | 87.8% | 87.8% |
| Range | 87.8% | 52.4% |
| Mean | 11.7% | 52.9% |
| Median | 5.4% | 52.0% |
| Interquartile 25% (IQ1) | 2.7% | 44.7% |
| Interquartile 75% (IQ3) | 10.1% | 60.7% |
| Interquartile Range (IQR) | 7.4% | 16.0% |
| Standard Deviation (Sample) | 20.3% | 11.8% |
| Standard Deviation (Population) | 19.9% | 11.5% |
Correlation Details
| Fijian Percentile | Sample Size | College, Under 1 year |
[ 0.0% - 0.5% ] 0.040% | 51,731,887 | 64.8% |
[ 0.5% - 1.0% ] 0.63% | 2,361,721 | 63.4% |
[ 1.0% - 1.5% ] 1.07% | 683,444 | 58.0% |
[ 1.5% - 2.0% ] 1.55% | 350,108 | 54.3% |
[ 1.5% - 2.0% ] 1.98% | 236,434 | 61.0% |
[ 2.0% - 2.5% ] 2.39% | 95,435 | 51.4% |
[ 2.5% - 3.0% ] 2.92% | 153,095 | 55.5% |
[ 3.0% - 3.5% ] 3.20% | 46,136 | 51.8% |
[ 3.5% - 4.0% ] 3.81% | 13,406 | 50.6% |
[ 4.0% - 4.5% ] 4.18% | 38,856 | 62.8% |
[ 4.5% - 5.0% ] 4.65% | 52,781 | 49.0% |
[ 5.0% - 5.5% ] 5.23% | 4,222 | 36.5% |
[ 5.0% - 5.5% ] 5.43% | 774 | 35.5% |
[ 5.5% - 6.0% ] 5.94% | 101 | 38.5% |
[ 6.5% - 7.0% ] 6.55% | 86,705 | 47.3% |
[ 8.5% - 9.0% ] 8.57% | 58,066 | 42.2% |
[ 8.5% - 9.0% ] 8.84% | 25,892 | 39.2% |
[ 9.0% - 9.5% ] 9.40% | 4,628 | 52.7% |
[ 9.5% - 10.0% ] 9.73% | 401 | 52.0% |
[ 10.0% - 10.5% ] 10.46% | 1,243 | 36.6% |
[ 10.5% - 11.0% ] 10.93% | 1,674 | 60.4% |
[ 12.5% - 13.0% ] 12.52% | 1,462 | 56.8% |
[ 19.5% - 20.0% ] 19.70% | 198 | 48.7% |
[ 65.5% - 66.0% ] 65.66% | 99 | 65.7% |
[ 87.5% - 88.0% ] 87.84% | 74 | 87.8% |