Fijian GED/Equivalency
COMPARE
Fijian
Select to Compare
GED/Equivalency
Fijian GED/Equivalency
81.6%
GED/EQUIVALENCY
0.0/ 100
METRIC RATING
300th/ 347
METRIC RANK
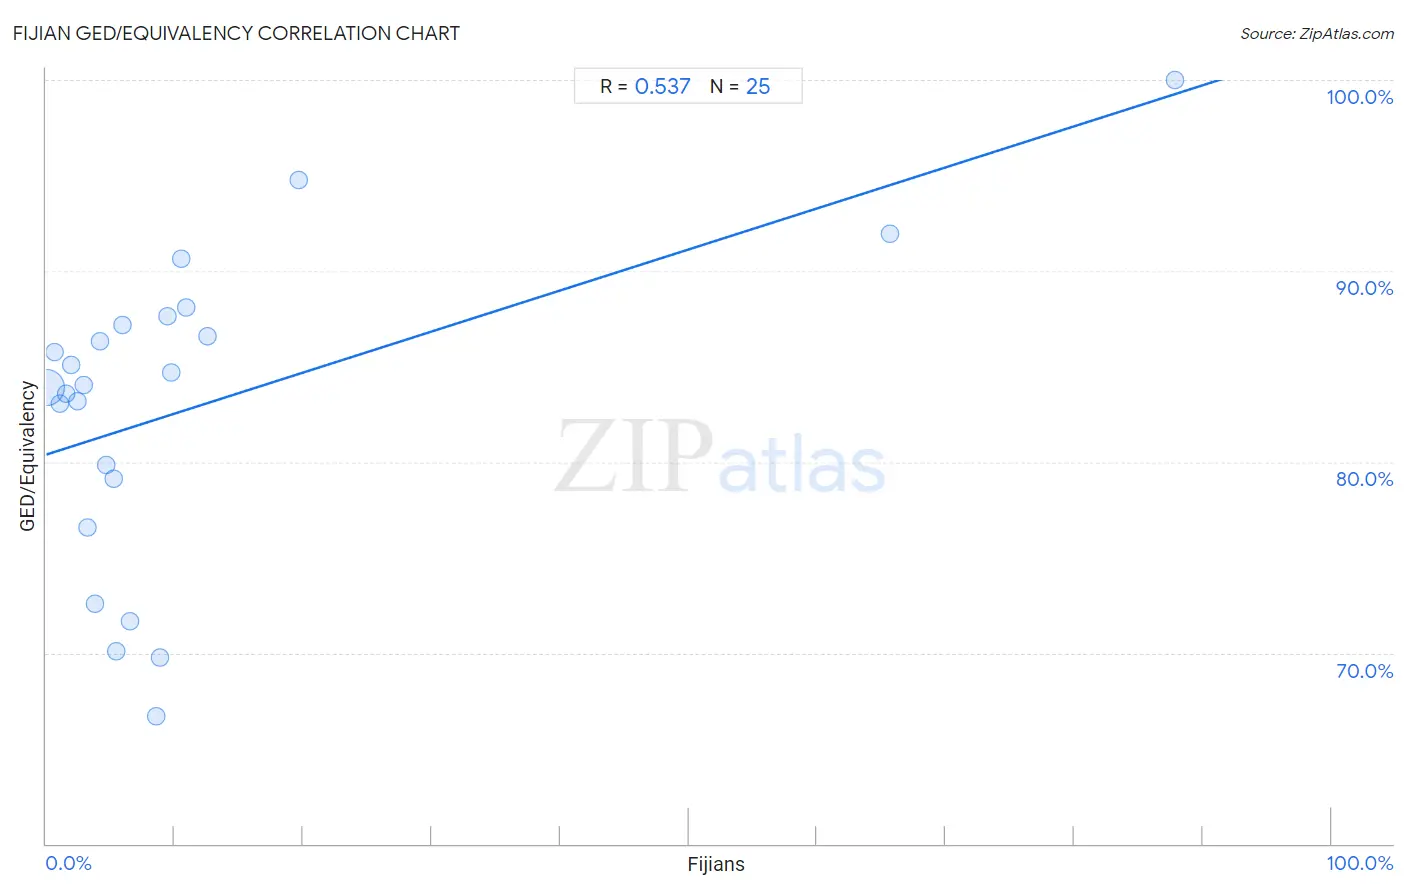
Fijian GED/Equivalency Correlation Chart
The statistical analysis conducted on geographies consisting of 55,948,842 people shows a substantial positive correlation between the proportion of Fijians and percentage of population with at least ged/equivalency education in the United States with a correlation coefficient (R) of 0.537 and weighted average of 81.6%. On average, for every 1% (one percent) increase in Fijians within a typical geography, there is an increase of 0.21% in percentage of population with at least ged/equivalency education.
It is essential to understand that the correlation between the percentage of Fijians and percentage of population with at least ged/equivalency education does not imply a direct cause-and-effect relationship. It remains uncertain whether the presence of Fijians influences an upward or downward trend in the level of percentage of population with at least ged/equivalency education within an area, or if Fijians simply ended up residing in those areas with higher or lower levels of percentage of population with at least ged/equivalency education due to other factors.
Demographics Similar to Fijians by GED/Equivalency
In terms of ged/equivalency, the demographic groups most similar to Fijians are Dutch West Indian (81.6%, a difference of 0.060%), Ecuadorian (81.7%, a difference of 0.070%), Immigrants from Haiti (81.6%, a difference of 0.10%), Immigrants from Portugal (81.6%, a difference of 0.10%), and Ute (81.8%, a difference of 0.20%).
| Demographics | Rating | Rank | GED/Equivalency |
| British West Indians | 0.0 /100 | #293 | Tragic 82.0% |
| Immigrants from St. Vincent and the Grenadines | 0.0 /100 | #294 | Tragic 82.0% |
| Nepalese | 0.0 /100 | #295 | Tragic 81.9% |
| Vietnamese | 0.0 /100 | #296 | Tragic 81.9% |
| Immigrants from Bangladesh | 0.0 /100 | #297 | Tragic 81.9% |
| Ute | 0.0 /100 | #298 | Tragic 81.8% |
| Ecuadorians | 0.0 /100 | #299 | Tragic 81.7% |
| Fijians | 0.0 /100 | #300 | Tragic 81.6% |
| Dutch West Indians | 0.0 /100 | #301 | Tragic 81.6% |
| Immigrants from Haiti | 0.0 /100 | #302 | Tragic 81.6% |
| Immigrants from Portugal | 0.0 /100 | #303 | Tragic 81.6% |
| Navajo | 0.0 /100 | #304 | Tragic 81.5% |
| Immigrants from Grenada | 0.0 /100 | #305 | Tragic 81.3% |
| Guyanese | 0.0 /100 | #306 | Tragic 81.3% |
| Immigrants from Dominica | 0.0 /100 | #307 | Tragic 81.1% |
Fijian GED/Equivalency Correlation Summary
| Measurement | Fijian Data | GED/Equivalency Data |
| Minimum | 0.040% | 66.7% |
| Maximum | 87.8% | 100.0% |
| Range | 87.8% | 33.3% |
| Mean | 11.7% | 82.9% |
| Median | 5.4% | 84.0% |
| Interquartile 25% (IQ1) | 2.7% | 77.9% |
| Interquartile 75% (IQ3) | 10.1% | 87.4% |
| Interquartile Range (IQR) | 7.4% | 9.6% |
| Standard Deviation (Sample) | 20.3% | 8.1% |
| Standard Deviation (Population) | 19.9% | 8.0% |
Correlation Details
| Fijian Percentile | Sample Size | GED/Equivalency |
[ 0.0% - 0.5% ] 0.040% | 51,731,887 | 83.9% |
[ 0.5% - 1.0% ] 0.63% | 2,361,721 | 85.8% |
[ 1.0% - 1.5% ] 1.07% | 683,444 | 83.0% |
[ 1.5% - 2.0% ] 1.55% | 350,108 | 83.6% |
[ 1.5% - 2.0% ] 1.98% | 236,434 | 85.1% |
[ 2.0% - 2.5% ] 2.39% | 95,435 | 83.2% |
[ 2.5% - 3.0% ] 2.92% | 153,095 | 84.0% |
[ 3.0% - 3.5% ] 3.20% | 46,136 | 76.6% |
[ 3.5% - 4.0% ] 3.81% | 13,406 | 72.5% |
[ 4.0% - 4.5% ] 4.18% | 38,856 | 86.3% |
[ 4.5% - 5.0% ] 4.65% | 52,781 | 79.8% |
[ 5.0% - 5.5% ] 5.23% | 4,222 | 79.1% |
[ 5.0% - 5.5% ] 5.43% | 774 | 70.1% |
[ 5.5% - 6.0% ] 5.94% | 101 | 87.2% |
[ 6.5% - 7.0% ] 6.55% | 86,705 | 71.7% |
[ 8.5% - 9.0% ] 8.57% | 58,066 | 66.7% |
[ 8.5% - 9.0% ] 8.84% | 25,892 | 69.7% |
[ 9.0% - 9.5% ] 9.40% | 4,628 | 87.6% |
[ 9.5% - 10.0% ] 9.73% | 401 | 84.7% |
[ 10.0% - 10.5% ] 10.46% | 1,243 | 90.6% |
[ 10.5% - 11.0% ] 10.93% | 1,674 | 88.1% |
[ 12.5% - 13.0% ] 12.52% | 1,462 | 86.6% |
[ 19.5% - 20.0% ] 19.70% | 198 | 94.8% |
[ 65.5% - 66.0% ] 65.66% | 99 | 91.9% |
[ 87.5% - 88.0% ] 87.84% | 74 | 100.0% |