Fijian Self-Care Disability
COMPARE
Fijian
Select to Compare
Self-Care Disability
Fijian Self-Care Disability
2.7%
SELF-CARE DISABILITY
0.0/ 100
METRIC RATING
284th/ 347
METRIC RANK
Fijian Self-Care Disability Correlation Chart
The statistical analysis conducted on geographies consisting of 55,939,234 people shows a substantial positive correlation between the proportion of Fijians and percentage of population with self-care disability in the United States with a correlation coefficient (R) of 0.543 and weighted average of 2.7%. On average, for every 1% (one percent) increase in Fijians within a typical geography, there is an increase of 0.14% in percentage of population with self-care disability.
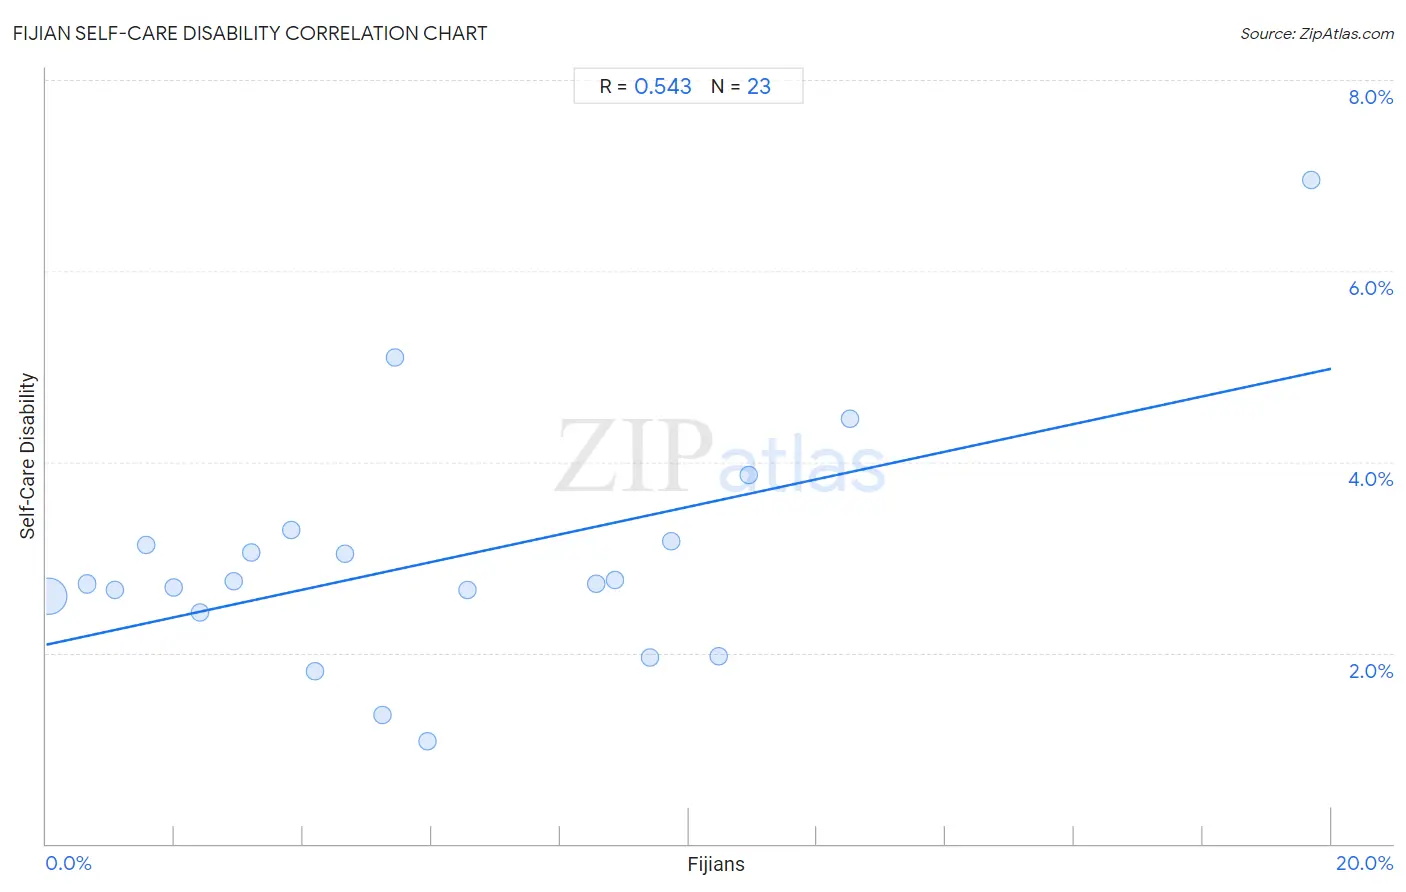
It is essential to understand that the correlation between the percentage of Fijians and percentage of population with self-care disability does not imply a direct cause-and-effect relationship. It remains uncertain whether the presence of Fijians influences an upward or downward trend in the level of percentage of population with self-care disability within an area, or if Fijians simply ended up residing in those areas with higher or lower levels of percentage of population with self-care disability due to other factors.
Demographics Similar to Fijians by Self-Care Disability
In terms of self-care disability, the demographic groups most similar to Fijians are Jamaican (2.7%, a difference of 0.040%), Delaware (2.7%, a difference of 0.050%), Apache (2.7%, a difference of 0.12%), Immigrants from Iraq (2.7%, a difference of 0.13%), and Hispanic or Latino (2.7%, a difference of 0.29%).
| Demographics | Rating | Rank | Self-Care Disability |
| Immigrants from Ukraine | 0.1 /100 | #277 | Tragic 2.7% |
| Ottawa | 0.1 /100 | #278 | Tragic 2.7% |
| Iroquois | 0.1 /100 | #279 | Tragic 2.7% |
| Hispanics or Latinos | 0.1 /100 | #280 | Tragic 2.7% |
| Immigrants from Iraq | 0.0 /100 | #281 | Tragic 2.7% |
| Apache | 0.0 /100 | #282 | Tragic 2.7% |
| Delaware | 0.0 /100 | #283 | Tragic 2.7% |
| Fijians | 0.0 /100 | #284 | Tragic 2.7% |
| Jamaicans | 0.0 /100 | #285 | Tragic 2.7% |
| French American Indians | 0.0 /100 | #286 | Tragic 2.7% |
| Immigrants from Jamaica | 0.0 /100 | #287 | Tragic 2.7% |
| Immigrants from Barbados | 0.0 /100 | #288 | Tragic 2.7% |
| Africans | 0.0 /100 | #289 | Tragic 2.7% |
| Cubans | 0.0 /100 | #290 | Tragic 2.7% |
| Guyanese | 0.0 /100 | #291 | Tragic 2.7% |
Fijian Self-Care Disability Correlation Summary
| Measurement | Fijian Data | Self-Care Disability Data |
| Minimum | 0.040% | 1.1% |
| Maximum | 19.7% | 7.0% |
| Range | 19.7% | 5.9% |
| Mean | 6.1% | 3.0% |
| Median | 5.2% | 2.7% |
| Interquartile 25% (IQ1) | 2.4% | 2.4% |
| Interquartile 75% (IQ3) | 9.4% | 3.2% |
| Interquartile Range (IQR) | 7.0% | 0.75% |
| Standard Deviation (Sample) | 4.7% | 1.2% |
| Standard Deviation (Population) | 4.6% | 1.2% |
Correlation Details
| Fijian Percentile | Sample Size | Self-Care Disability |
[ 0.0% - 0.5% ] 0.040% | 51,727,592 | 2.6% |
[ 0.5% - 1.0% ] 0.63% | 2,359,893 | 2.7% |
[ 1.0% - 1.5% ] 1.07% | 683,444 | 2.7% |
[ 1.5% - 2.0% ] 1.55% | 349,494 | 3.1% |
[ 1.5% - 2.0% ] 1.98% | 236,276 | 2.7% |
[ 2.0% - 2.5% ] 2.39% | 95,001 | 2.4% |
[ 2.5% - 3.0% ] 2.92% | 151,958 | 2.8% |
[ 3.0% - 3.5% ] 3.20% | 45,426 | 3.0% |
[ 3.5% - 4.0% ] 3.81% | 13,176 | 3.3% |
[ 4.0% - 4.5% ] 4.18% | 38,856 | 1.8% |
[ 4.5% - 5.0% ] 4.65% | 52,781 | 3.0% |
[ 5.0% - 5.5% ] 5.23% | 4,222 | 1.4% |
[ 5.0% - 5.5% ] 5.43% | 774 | 5.1% |
[ 5.5% - 6.0% ] 5.94% | 101 | 1.1% |
[ 6.5% - 7.0% ] 6.55% | 86,705 | 2.7% |
[ 8.5% - 9.0% ] 8.57% | 58,066 | 2.7% |
[ 8.5% - 9.0% ] 8.84% | 25,892 | 2.8% |
[ 9.0% - 9.5% ] 9.40% | 4,628 | 2.0% |
[ 9.5% - 10.0% ] 9.73% | 401 | 3.2% |
[ 10.0% - 10.5% ] 10.46% | 1,214 | 2.0% |
[ 10.5% - 11.0% ] 10.93% | 1,674 | 3.9% |
[ 12.5% - 13.0% ] 12.52% | 1,462 | 4.4% |
[ 19.5% - 20.0% ] 19.70% | 198 | 7.0% |