Fijian Married-couple Households
COMPARE
Fijian
Select to Compare
Married-couple Households
Fijian Married-couple Households
46.1%
MARRIED-COUPLE HOUSEHOLDS
29.2/ 100
METRIC RATING
187th/ 347
METRIC RANK
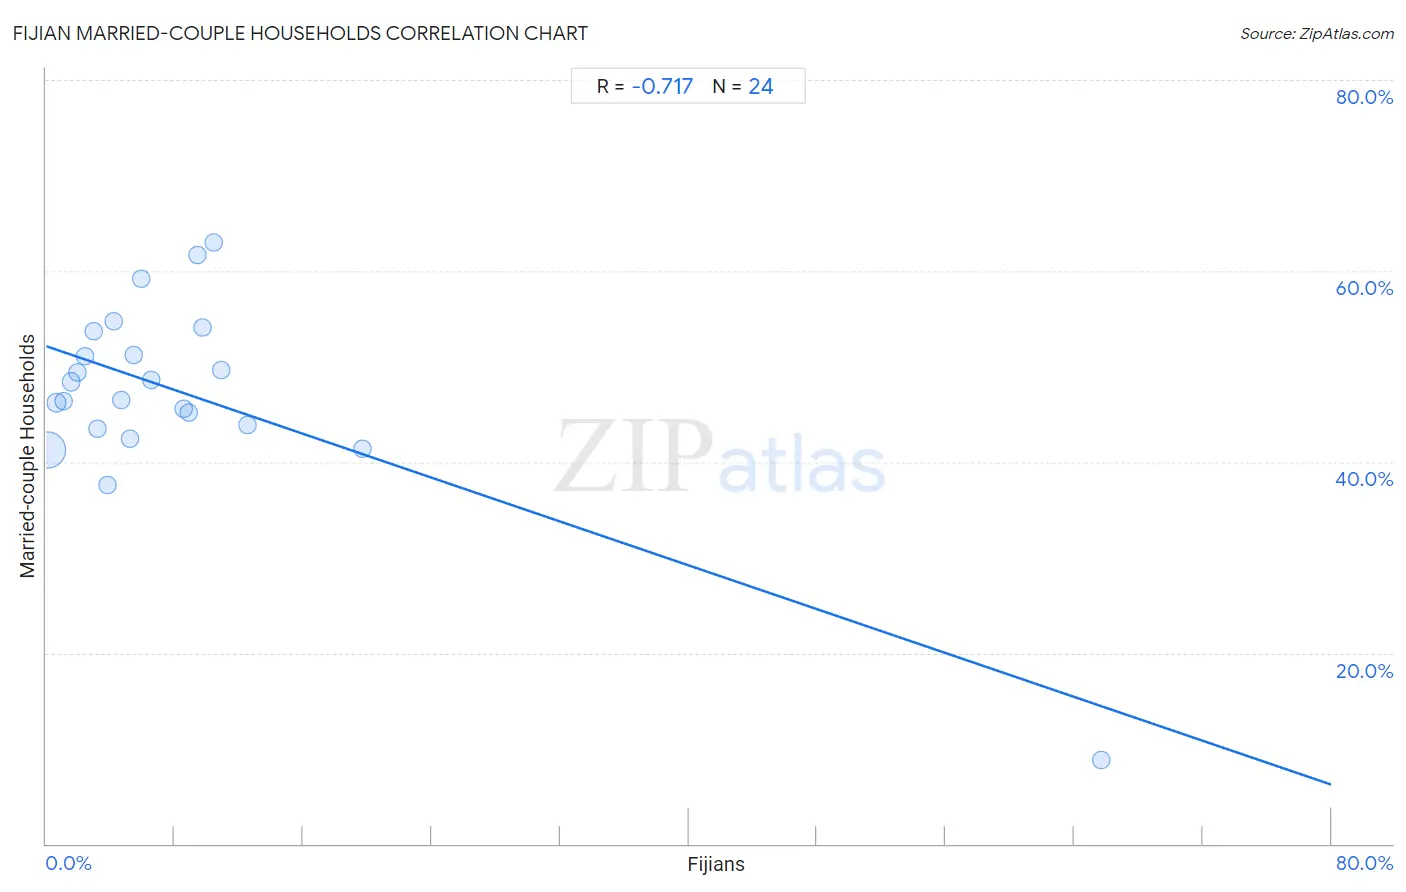
Fijian Married-couple Households Correlation Chart
The statistical analysis conducted on geographies consisting of 55,947,966 people shows a strong negative correlation between the proportion of Fijians and percentage of married-couple family households in the United States with a correlation coefficient (R) of -0.717 and weighted average of 46.1%. On average, for every 1% (one percent) increase in Fijians within a typical geography, there is a decrease of 0.57% in percentage of married-couple family households.
It is essential to understand that the correlation between the percentage of Fijians and percentage of married-couple family households does not imply a direct cause-and-effect relationship. It remains uncertain whether the presence of Fijians influences an upward or downward trend in the level of percentage of married-couple family households within an area, or if Fijians simply ended up residing in those areas with higher or lower levels of percentage of married-couple family households due to other factors.
Demographics Similar to Fijians by Married-couple Households
In terms of married-couple households, the demographic groups most similar to Fijians are South American Indian (46.0%, a difference of 0.040%), Albanian (46.1%, a difference of 0.080%), Immigrants from Latvia (46.0%, a difference of 0.11%), Immigrants from Kuwait (46.0%, a difference of 0.18%), and Choctaw (46.0%, a difference of 0.21%).
| Demographics | Rating | Rank | Married-couple Households |
| Mongolians | 42.0 /100 | #180 | Average 46.3% |
| Malaysians | 41.8 /100 | #181 | Average 46.3% |
| Yugoslavians | 38.9 /100 | #182 | Fair 46.2% |
| Immigrants from Brazil | 38.3 /100 | #183 | Fair 46.2% |
| Immigrants from Switzerland | 36.9 /100 | #184 | Fair 46.2% |
| Brazilians | 35.9 /100 | #185 | Fair 46.2% |
| Albanians | 31.1 /100 | #186 | Fair 46.1% |
| Fijians | 29.2 /100 | #187 | Fair 46.1% |
| South American Indians | 28.4 /100 | #188 | Fair 46.0% |
| Immigrants from Latvia | 26.9 /100 | #189 | Fair 46.0% |
| Immigrants from Kuwait | 25.6 /100 | #190 | Fair 46.0% |
| Choctaw | 24.9 /100 | #191 | Fair 46.0% |
| Immigrants from Northern Africa | 24.6 /100 | #192 | Fair 46.0% |
| Taiwanese | 23.4 /100 | #193 | Fair 45.9% |
| Mexican American Indians | 23.3 /100 | #194 | Fair 45.9% |
Fijian Married-couple Households Correlation Summary
| Measurement | Fijian Data | Married-couple Households Data |
| Minimum | 0.040% | 8.8% |
| Maximum | 65.7% | 63.0% |
| Range | 65.6% | 54.2% |
| Mean | 8.6% | 47.2% |
| Median | 5.3% | 47.5% |
| Interquartile 25% (IQ1) | 2.7% | 43.7% |
| Interquartile 75% (IQ3) | 9.6% | 52.4% |
| Interquartile Range (IQR) | 6.9% | 8.7% |
| Standard Deviation (Sample) | 13.0% | 10.4% |
| Standard Deviation (Population) | 12.7% | 10.2% |
Correlation Details
| Fijian Percentile | Sample Size | Married-couple Households |
[ 0.0% - 0.5% ] 0.040% | 51,731,887 | 41.2% |
[ 0.5% - 1.0% ] 0.63% | 2,360,948 | 46.2% |
[ 1.0% - 1.5% ] 1.07% | 683,444 | 46.3% |
[ 1.5% - 2.0% ] 1.55% | 350,108 | 48.4% |
[ 1.5% - 2.0% ] 1.98% | 236,434 | 49.3% |
[ 2.0% - 2.5% ] 2.39% | 95,435 | 51.1% |
[ 2.5% - 3.0% ] 2.92% | 153,095 | 53.7% |
[ 3.0% - 3.5% ] 3.20% | 46,136 | 43.5% |
[ 3.5% - 4.0% ] 3.81% | 13,406 | 37.6% |
[ 4.0% - 4.5% ] 4.18% | 38,856 | 54.7% |
[ 4.5% - 5.0% ] 4.65% | 52,781 | 46.5% |
[ 5.0% - 5.5% ] 5.23% | 4,222 | 42.4% |
[ 5.0% - 5.5% ] 5.43% | 774 | 51.1% |
[ 5.5% - 6.0% ] 5.94% | 101 | 59.2% |
[ 6.5% - 7.0% ] 6.55% | 86,705 | 48.5% |
[ 8.5% - 9.0% ] 8.57% | 58,066 | 45.5% |
[ 8.5% - 9.0% ] 8.84% | 25,892 | 45.1% |
[ 9.0% - 9.5% ] 9.40% | 4,628 | 61.7% |
[ 9.5% - 10.0% ] 9.73% | 401 | 54.0% |
[ 10.0% - 10.5% ] 10.46% | 1,214 | 63.0% |
[ 10.5% - 11.0% ] 10.93% | 1,674 | 49.6% |
[ 12.5% - 13.0% ] 12.52% | 1,462 | 43.9% |
[ 19.5% - 20.0% ] 19.70% | 198 | 41.4% |
[ 65.5% - 66.0% ] 65.66% | 99 | 8.8% |