Fijian Male Disability
COMPARE
Fijian
Select to Compare
Male Disability
Fijian Male Disability
12.6%
DISABILITY | MALES
0.0/ 100
METRIC RATING
275th/ 347
METRIC RANK
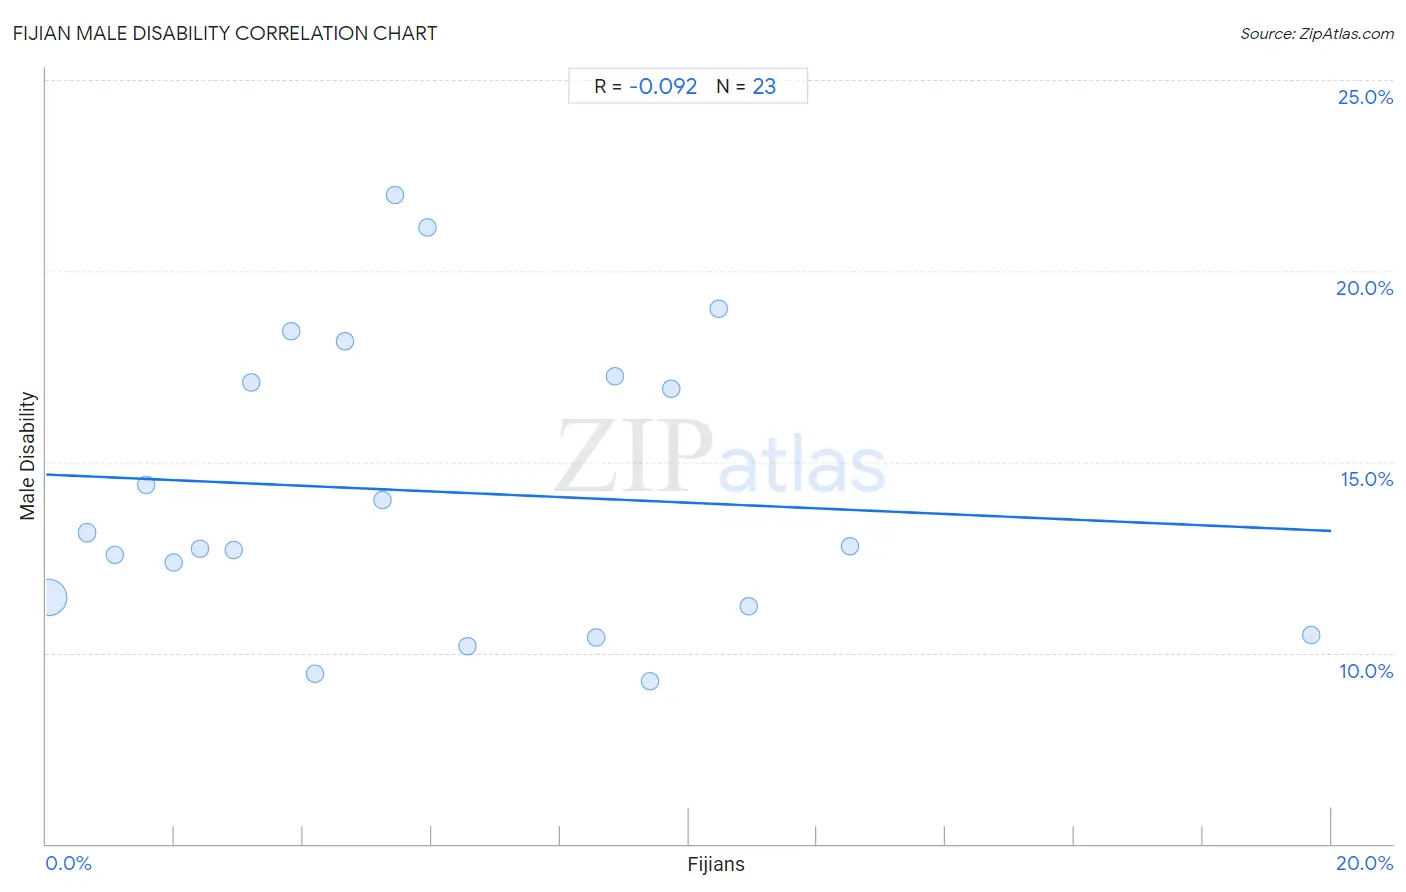
Fijian Male Disability Correlation Chart
The statistical analysis conducted on geographies consisting of 55,947,896 people shows a slight negative correlation between the proportion of Fijians and percentage of males with a disability in the United States with a correlation coefficient (R) of -0.092 and weighted average of 12.6%. On average, for every 1% (one percent) increase in Fijians within a typical geography, there is a decrease of 0.074% in percentage of males with a disability.
It is essential to understand that the correlation between the percentage of Fijians and percentage of males with a disability does not imply a direct cause-and-effect relationship. It remains uncertain whether the presence of Fijians influences an upward or downward trend in the level of percentage of males with a disability within an area, or if Fijians simply ended up residing in those areas with higher or lower levels of percentage of males with a disability due to other factors.
Demographics Similar to Fijians by Male Disability
In terms of male disability, the demographic groups most similar to Fijians are African (12.6%, a difference of 0.050%), Hopi (12.5%, a difference of 0.35%), Finnish (12.6%, a difference of 0.37%), Native Hawaiian (12.5%, a difference of 0.68%), and Hmong (12.5%, a difference of 0.75%).
| Demographics | Rating | Rank | Male Disability |
| Portuguese | 0.1 /100 | #268 | Tragic 12.3% |
| Czechoslovakians | 0.1 /100 | #269 | Tragic 12.3% |
| Spaniards | 0.1 /100 | #270 | Tragic 12.3% |
| Scandinavians | 0.1 /100 | #271 | Tragic 12.3% |
| Hmong | 0.0 /100 | #272 | Tragic 12.5% |
| Native Hawaiians | 0.0 /100 | #273 | Tragic 12.5% |
| Hopi | 0.0 /100 | #274 | Tragic 12.5% |
| Fijians | 0.0 /100 | #275 | Tragic 12.6% |
| Africans | 0.0 /100 | #276 | Tragic 12.6% |
| Finns | 0.0 /100 | #277 | Tragic 12.6% |
| Central American Indians | 0.0 /100 | #278 | Tragic 12.7% |
| Slovaks | 0.0 /100 | #279 | Tragic 12.7% |
| Dutch | 0.0 /100 | #280 | Tragic 12.7% |
| Sioux | 0.0 /100 | #281 | Tragic 12.7% |
| Irish | 0.0 /100 | #282 | Tragic 12.7% |
Fijian Male Disability Correlation Summary
| Measurement | Fijian Data | Male Disability Data |
| Minimum | 0.040% | 9.2% |
| Maximum | 19.7% | 22.0% |
| Range | 19.7% | 12.7% |
| Mean | 6.1% | 14.2% |
| Median | 5.2% | 12.8% |
| Interquartile 25% (IQ1) | 2.4% | 11.2% |
| Interquartile 75% (IQ3) | 9.4% | 17.3% |
| Interquartile Range (IQR) | 7.0% | 6.0% |
| Standard Deviation (Sample) | 4.7% | 3.8% |
| Standard Deviation (Population) | 4.6% | 3.7% |
Correlation Details
| Fijian Percentile | Sample Size | Male Disability |
[ 0.0% - 0.5% ] 0.040% | 51,731,887 | 11.4% |
[ 0.5% - 1.0% ] 0.63% | 2,360,948 | 13.1% |
[ 1.0% - 1.5% ] 1.07% | 683,444 | 12.6% |
[ 1.5% - 2.0% ] 1.55% | 350,108 | 14.4% |
[ 1.5% - 2.0% ] 1.98% | 236,434 | 12.4% |
[ 2.0% - 2.5% ] 2.39% | 95,435 | 12.7% |
[ 2.5% - 3.0% ] 2.92% | 153,095 | 12.7% |
[ 3.0% - 3.5% ] 3.20% | 46,136 | 17.1% |
[ 3.5% - 4.0% ] 3.81% | 13,406 | 18.4% |
[ 4.0% - 4.5% ] 4.18% | 38,856 | 9.5% |
[ 4.5% - 5.0% ] 4.65% | 52,781 | 18.2% |
[ 5.0% - 5.5% ] 5.23% | 4,222 | 14.0% |
[ 5.0% - 5.5% ] 5.43% | 774 | 22.0% |
[ 5.5% - 6.0% ] 5.94% | 101 | 21.2% |
[ 6.5% - 7.0% ] 6.55% | 86,705 | 10.2% |
[ 8.5% - 9.0% ] 8.57% | 58,066 | 10.4% |
[ 8.5% - 9.0% ] 8.84% | 25,892 | 17.3% |
[ 9.0% - 9.5% ] 9.40% | 4,628 | 9.2% |
[ 9.5% - 10.0% ] 9.73% | 401 | 16.9% |
[ 10.0% - 10.5% ] 10.46% | 1,243 | 19.0% |
[ 10.5% - 11.0% ] 10.93% | 1,674 | 11.2% |
[ 12.5% - 13.0% ] 12.52% | 1,462 | 12.8% |
[ 19.5% - 20.0% ] 19.70% | 198 | 10.5% |