Costa Rican College, Under 1 year
COMPARE
Costa Rican
Select to Compare
College, Under 1 year
Costa Rican College, Under 1 year
64.4%
COLLEGE, UNDER 1 YEAR
19.6/ 100
METRIC RATING
197th/ 347
METRIC RANK
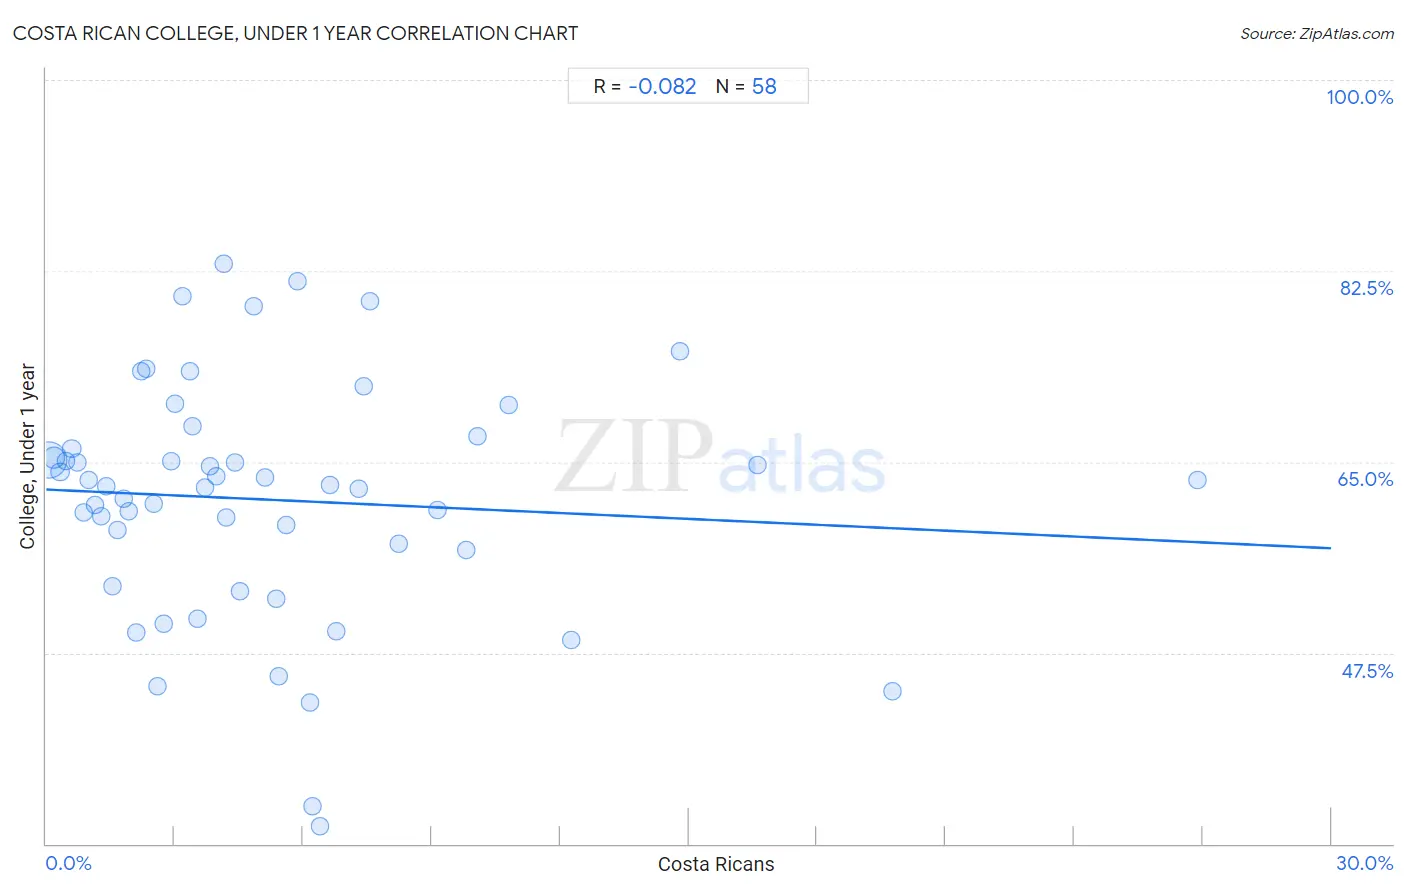
Costa Rican College, Under 1 year Correlation Chart
The statistical analysis conducted on geographies consisting of 253,601,310 people shows a slight negative correlation between the proportion of Costa Ricans and percentage of population with at least college, under 1 year education in the United States with a correlation coefficient (R) of -0.082 and weighted average of 64.4%. On average, for every 1% (one percent) increase in Costa Ricans within a typical geography, there is a decrease of 0.18% in percentage of population with at least college, under 1 year education.
It is essential to understand that the correlation between the percentage of Costa Ricans and percentage of population with at least college, under 1 year education does not imply a direct cause-and-effect relationship. It remains uncertain whether the presence of Costa Ricans influences an upward or downward trend in the level of percentage of population with at least college, under 1 year education within an area, or if Costa Ricans simply ended up residing in those areas with higher or lower levels of percentage of population with at least college, under 1 year education due to other factors.
Demographics Similar to Costa Ricans by College, Under 1 year
In terms of college, under 1 year, the demographic groups most similar to Costa Ricans are Tongan (64.5%, a difference of 0.11%), Tsimshian (64.3%, a difference of 0.13%), Immigrants from South Eastern Asia (64.5%, a difference of 0.17%), Panamanian (64.3%, a difference of 0.19%), and Nigerian (64.3%, a difference of 0.22%).
| Demographics | Rating | Rank | College, Under 1 year |
| Immigrants from Philippines | 30.1 /100 | #190 | Fair 64.8% |
| Immigrants from Armenia | 28.1 /100 | #191 | Fair 64.7% |
| Immigrants from Thailand | 27.0 /100 | #192 | Fair 64.7% |
| Slovaks | 26.7 /100 | #193 | Fair 64.7% |
| Immigrants from Cameroon | 24.6 /100 | #194 | Fair 64.6% |
| Immigrants from South Eastern Asia | 22.1 /100 | #195 | Fair 64.5% |
| Tongans | 21.2 /100 | #196 | Fair 64.5% |
| Costa Ricans | 19.6 /100 | #197 | Poor 64.4% |
| Tsimshian | 17.9 /100 | #198 | Poor 64.3% |
| Panamanians | 17.0 /100 | #199 | Poor 64.3% |
| Nigerians | 16.7 /100 | #200 | Poor 64.3% |
| French Canadians | 16.3 /100 | #201 | Poor 64.2% |
| South Americans | 16.2 /100 | #202 | Poor 64.2% |
| Uruguayans | 15.6 /100 | #203 | Poor 64.2% |
| Immigrants from Zaire | 14.6 /100 | #204 | Poor 64.1% |
Costa Rican College, Under 1 year Correlation Summary
| Measurement | Costa Rican Data | College, Under 1 year Data |
| Minimum | 0.054% | 31.6% |
| Maximum | 26.9% | 83.1% |
| Range | 26.8% | 51.5% |
| Mean | 5.2% | 61.5% |
| Median | 3.9% | 62.8% |
| Interquartile 25% (IQ1) | 1.9% | 56.9% |
| Interquartile 75% (IQ3) | 6.6% | 66.2% |
| Interquartile Range (IQR) | 4.7% | 9.3% |
| Standard Deviation (Sample) | 5.0% | 10.9% |
| Standard Deviation (Population) | 5.0% | 10.8% |
Correlation Details
| Costa Rican Percentile | Sample Size | College, Under 1 year |
[ 0.0% - 0.5% ] 0.054% | 193,645,789 | 65.1% |
[ 0.0% - 0.5% ] 0.19% | 35,491,257 | 65.4% |
[ 0.0% - 0.5% ] 0.33% | 11,355,629 | 64.1% |
[ 0.0% - 0.5% ] 0.46% | 4,996,050 | 65.1% |
[ 0.5% - 1.0% ] 0.59% | 2,812,418 | 66.2% |
[ 0.5% - 1.0% ] 0.73% | 1,719,023 | 64.9% |
[ 0.5% - 1.0% ] 0.87% | 890,528 | 60.4% |
[ 1.0% - 1.5% ] 1.00% | 648,588 | 63.3% |
[ 1.0% - 1.5% ] 1.13% | 353,272 | 61.0% |
[ 1.0% - 1.5% ] 1.28% | 324,312 | 60.0% |
[ 1.0% - 1.5% ] 1.41% | 218,565 | 62.7% |
[ 1.5% - 2.0% ] 1.55% | 140,157 | 53.6% |
[ 1.5% - 2.0% ] 1.68% | 147,760 | 58.7% |
[ 1.5% - 2.0% ] 1.81% | 73,547 | 61.6% |
[ 1.5% - 2.0% ] 1.93% | 202,355 | 60.5% |
[ 2.0% - 2.5% ] 2.10% | 90,548 | 49.4% |
[ 2.0% - 2.5% ] 2.22% | 38,329 | 73.3% |
[ 2.0% - 2.5% ] 2.33% | 35,924 | 73.5% |
[ 2.5% - 3.0% ] 2.51% | 11,161 | 61.2% |
[ 2.5% - 3.0% ] 2.60% | 45,765 | 44.5% |
[ 2.5% - 3.0% ] 2.74% | 30,438 | 50.2% |
[ 2.5% - 3.0% ] 2.91% | 70,951 | 65.0% |
[ 3.0% - 3.5% ] 3.01% | 40,321 | 70.3% |
[ 3.0% - 3.5% ] 3.19% | 8,266 | 80.2% |
[ 3.0% - 3.5% ] 3.35% | 24,178 | 73.3% |
[ 3.0% - 3.5% ] 3.42% | 12,649 | 68.2% |
[ 3.5% - 4.0% ] 3.53% | 1,273 | 50.6% |
[ 3.5% - 4.0% ] 3.71% | 2,292 | 62.6% |
[ 3.5% - 4.0% ] 3.83% | 21,507 | 64.6% |
[ 3.5% - 4.0% ] 3.96% | 30,866 | 63.7% |
[ 4.0% - 4.5% ] 4.14% | 8,954 | 83.1% |
[ 4.0% - 4.5% ] 4.20% | 786 | 59.9% |
[ 4.0% - 4.5% ] 4.41% | 9,781 | 65.0% |
[ 4.5% - 5.0% ] 4.52% | 9,105 | 53.1% |
[ 4.5% - 5.0% ] 4.84% | 3,309 | 79.3% |
[ 5.0% - 5.5% ] 5.10% | 16,602 | 63.6% |
[ 5.0% - 5.5% ] 5.36% | 616 | 52.4% |
[ 5.0% - 5.5% ] 5.42% | 277 | 45.3% |
[ 5.5% - 6.0% ] 5.60% | 1,519 | 59.2% |
[ 5.5% - 6.0% ] 5.85% | 8,287 | 81.6% |
[ 6.0% - 6.5% ] 6.15% | 1,594 | 43.0% |
[ 6.0% - 6.5% ] 6.22% | 5,373 | 33.4% |
[ 6.0% - 6.5% ] 6.39% | 5,226 | 31.6% |
[ 6.5% - 7.0% ] 6.61% | 9,676 | 62.9% |
[ 6.5% - 7.0% ] 6.78% | 915 | 49.5% |
[ 7.0% - 7.5% ] 7.29% | 398 | 62.6% |
[ 7.0% - 7.5% ] 7.41% | 297 | 72.0% |
[ 7.5% - 8.0% ] 7.55% | 159 | 79.7% |
[ 8.0% - 8.5% ] 8.24% | 14,778 | 57.5% |
[ 9.0% - 9.5% ] 9.14% | 372 | 60.6% |
[ 9.5% - 10.0% ] 9.80% | 11,906 | 56.9% |
[ 10.0% - 10.5% ] 10.07% | 1,132 | 67.3% |
[ 10.5% - 11.0% ] 10.81% | 657 | 70.2% |
[ 12.0% - 12.5% ] 12.24% | 98 | 48.6% |
[ 14.5% - 15.0% ] 14.80% | 4,771 | 75.2% |
[ 16.5% - 17.0% ] 16.60% | 253 | 64.7% |
[ 19.5% - 20.0% ] 19.76% | 167 | 44.0% |
[ 26.5% - 27.0% ] 26.88% | 584 | 63.4% |