Costa Rican Married-Couple Family Poverty

COMPARE

Costa Rican
Race
Ancestry
AfghanAfricanAlaska NativeAlaskan AthabascanAlbanianAleutAlsatianAmericanApacheArabArapahoArgentineanArmenianAssyrian/Chaldean/SyriacAustralianAustrianBahamianBangladeshiBarbadianBasqueBelgianBelizeanBermudanBhutaneseBlackfeetBolivianBrazilianBritishBritish West IndianBulgarianBurmeseCajunCambodianCanadianCape VerdeanCarpatho RusynCelticCentral AmericanCentral American IndianCherokeeCheyenneChickasawChileanChineseChippewaChoctawColombianColvilleComancheCosta RicanCreeCreekCroatianCrowCubanCypriotCzechCzechoslovakianDanishDelawareDominicanDutchDutch West IndianEastern EuropeanEcuadorianEgyptianEnglishEstonianEthiopianEuropeanFijianFilipinoFinnishFrenchFrench American IndianFrench CanadianGermanGerman RussianGhanaianGreekGuamanian/ChamorroGuatemalanGuyaneseHaitianHmongHonduranHopiHoumaHungarianIcelanderIndian (Asian)IndonesianInupiatIranianIraqiIrishIroquoisIsraeliItalianJamaicanJapaneseJordanianKenyanKiowaKoreanLaotianLatvianLebaneseLiberianLithuanianLumbeeLuxembourgerMacedonianMalaysianMalteseMarshalleseMenomineeMexicanMexican American IndianMongolianMoroccanNative HawaiianNavajoNepaleseNew ZealanderNicaraguanNigerianNorthern EuropeanNorwegianOkinawanOsageOttawaPaiutePakistaniPalestinianPanamanianParaguayanPennsylvania GermanPeruvianPimaPolishPortuguesePotawatomiPuebloPuerto RicanPuget Sound SalishRomanianRussianSalvadoranSamoanScandinavianScotch-IrishScottishSeminoleSenegaleseSerbianShoshoneSierra LeoneanSiouxSlavicSlovakSloveneSomaliSouth AfricanSouth AmericanSouth American IndianSoviet UnionSpaniardSpanishSpanish AmericanSpanish American IndianSri LankanSubsaharan AfricanSudaneseSwedishSwissSyrianTaiwaneseThaiTlingit-HaidaTohono O'OdhamTonganTrinidadian and TobagonianTsimshianTurkishU.S. Virgin IslanderUgandanUkrainianUruguayanUteVenezuelanVietnameseWelshWest IndianYakamaYaquiYugoslavianYumanYup'ikZimbabwean
Immigration
NonimmigrantsImmigrantsAfghanistanAfricaAlbaniaArgentinaArmeniaAsiaAustraliaAustriaBahamasBangladeshBarbadosBelarusBelgiumBelizeBoliviaBosnia and HerzegovinaBrazilBulgariaBurma/MyanmarCabo VerdeCambodiaCameroonCanadaCaribbeanCentral AmericaChileChinaColombiaCongoCosta RicaCroatiaCubaCzechoslovakiaDenmarkDominicaDominican RepublicEastern AfricaEastern AsiaEastern EuropeEcuadorEgyptEl SalvadorEnglandEritreaEthiopiaEuropeFijiFranceGermanyGhanaGreeceGrenadaGuatemalaGuyanaHaitiHondurasHong KongHungaryIndiaIndonesiaIranIraqIrelandIsraelItalyJamaicaJapanJordanKazakhstanKenyaKoreaKuwaitLaosLatin AmericaLatviaLebanonLiberiaLithuaniaMalaysiaMexicoMicronesiaMiddle AfricaMoldovaMoroccoNepalNetherlandsNicaraguaNigeriaNorth AmericaNorth MacedoniaNorthern AfricaNorthern EuropeNorwayOceaniaPakistanPanamaPeruPhilippinesPolandPortugalRomaniaRussiaSaudi ArabiaScotlandSenegalSerbiaSierra LeoneSingaporeSomaliaSouth AfricaSouth AmericaSouth Central AsiaSouth Eastern AsiaSouthern EuropeSpainSri LankaSt. Vincent and the GrenadinesSudanSwedenSwitzerlandSyriaTaiwanThailandTrinidad and TobagoTurkeyUgandaUkraineUruguayUzbekistanVenezuelaVietnamWest IndiesWestern AfricaWestern AsiaWestern EuropeYemenZaireZimbabweAzores
Select to Compare
Race
Ancestry
AfghanAfricanAlaska NativeAlaskan AthabascanAlbanianAleutAlsatianAmericanApacheArabArapahoArgentineanArmenianAssyrian/Chaldean/SyriacAustralianAustrianBahamianBangladeshiBarbadianBasqueBelgianBelizeanBermudanBhutaneseBlackfeetBolivianBrazilianBritishBritish West IndianBulgarianBurmeseCajunCambodianCanadianCape VerdeanCarpatho RusynCelticCentral AmericanCentral American IndianCherokeeCheyenneChickasawChileanChineseChippewaChoctawColombianColvilleComancheCreeCreekCroatianCrowCubanCypriotCzechCzechoslovakianDanishDelawareDominicanDutchDutch West IndianEastern EuropeanEcuadorianEgyptianEnglishEstonianEthiopianEuropeanFijianFilipinoFinnishFrenchFrench American IndianFrench CanadianGermanGerman RussianGhanaianGreekGuamanian/ChamorroGuatemalanGuyaneseHaitianHmongHonduranHopiHoumaHungarianIcelanderIndian (Asian)IndonesianInupiatIranianIraqiIrishIroquoisIsraeliItalianJamaicanJapaneseJordanianKenyanKiowaKoreanLaotianLatvianLebaneseLiberianLithuanianLumbeeLuxembourgerMacedonianMalaysianMalteseMarshalleseMenomineeMexicanMexican American IndianMongolianMoroccanNative HawaiianNavajoNepaleseNew ZealanderNicaraguanNigerianNorthern EuropeanNorwegianOkinawanOsageOttawaPaiutePakistaniPalestinianPanamanianParaguayanPennsylvania GermanPeruvianPimaPolishPortuguesePotawatomiPuebloPuerto RicanPuget Sound SalishRomanianRussianSalvadoranSamoanScandinavianScotch-IrishScottishSeminoleSenegaleseSerbianShoshoneSierra LeoneanSiouxSlavicSlovakSloveneSomaliSouth AfricanSouth AmericanSouth American IndianSoviet UnionSpaniardSpanishSpanish AmericanSpanish American IndianSri LankanSubsaharan AfricanSudaneseSwedishSwissSyrianTaiwaneseThaiTlingit-HaidaTohono O'OdhamTonganTrinidadian and TobagonianTsimshianTurkishU.S. Virgin IslanderUgandanUkrainianUruguayanUteVenezuelanVietnameseWelshWest IndianYakamaYaquiYugoslavianYumanYup'ikZimbabwean
Immigration
NonimmigrantsImmigrantsAfghanistanAfricaAlbaniaArgentinaArmeniaAsiaAustraliaAustriaBahamasBangladeshBarbadosBelarusBelgiumBelizeBoliviaBosnia and HerzegovinaBrazilBulgariaBurma/MyanmarCabo VerdeCambodiaCameroonCanadaCaribbeanCentral AmericaChileChinaColombiaCongoCosta RicaCroatiaCubaCzechoslovakiaDenmarkDominicaDominican RepublicEastern AfricaEastern AsiaEastern EuropeEcuadorEgyptEl SalvadorEnglandEritreaEthiopiaEuropeFijiFranceGermanyGhanaGreeceGrenadaGuatemalaGuyanaHaitiHondurasHong KongHungaryIndiaIndonesiaIranIraqIrelandIsraelItalyJamaicaJapanJordanKazakhstanKenyaKoreaKuwaitLaosLatin AmericaLatviaLebanonLiberiaLithuaniaMalaysiaMexicoMicronesiaMiddle AfricaMoldovaMoroccoNepalNetherlandsNicaraguaNigeriaNorth AmericaNorth MacedoniaNorthern AfricaNorthern EuropeNorwayOceaniaPakistanPanamaPeruPhilippinesPolandPortugalRomaniaRussiaSaudi ArabiaScotlandSenegalSerbiaSierra LeoneSingaporeSomaliaSouth AfricaSouth AmericaSouth Central AsiaSouth Eastern AsiaSouthern EuropeSpainSri LankaSt. Vincent and the GrenadinesSudanSwedenSwitzerlandSyriaTaiwanThailandTrinidad and TobagoTurkeyUgandaUkraineUruguayUzbekistanVenezuelaVietnamWest IndiesWestern AfricaWestern AsiaWestern EuropeYemenZaireZimbabweAzores
Married-Couple Family Poverty
Income
Poverty
Unemployment
Labor Participation
Family Structure
Vehicle Availability
Education Level
Disability

Costa Rican Married-Couple Family Poverty
Good

5.1%
POVERTY | MARRIED-COUPLE FAMILIES
61.5/ 100
METRIC RATING
167th/ 347
METRIC RANK

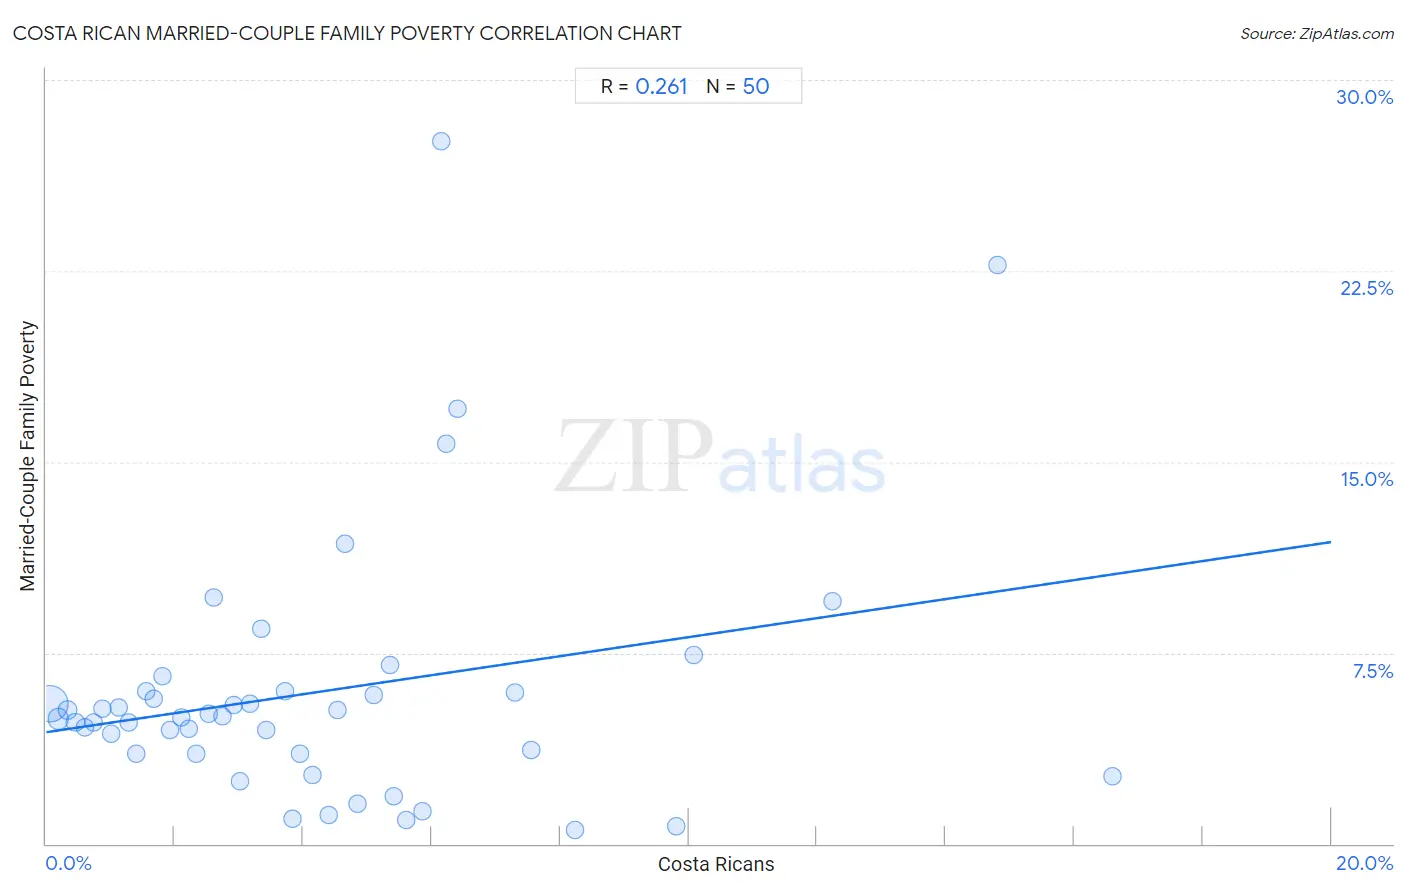
Costa Rican Married-Couple Family Poverty Correlation Chart

The statistical analysis conducted on geographies consisting of 252,586,429 people shows a weak positive correlation between the proportion of Costa Ricans and poverty level among married-couple families in the United States with a correlation coefficient (R) of 0.261 and weighted average of 5.1%. On average, for every 1% (one percent) increase in Costa Ricans within a typical geography, there is an increase of 0.37% in poverty level among married-couple families.
Costa Rican Married-Couple Family Poverty
It is essential to understand that the correlation between the percentage of Costa Ricans and poverty level among married-couple families does not imply a direct cause-and-effect relationship. It remains uncertain whether the presence of Costa Ricans influences an upward or downward trend in the level of poverty level among married-couple families within an area, or if Costa Ricans simply ended up residing in those areas with higher or lower levels of poverty level among married-couple families due to other factors.

Demographics Similar to Costa Ricans by Married-Couple Family Poverty

In terms of married-couple family poverty, the demographic groups most similar to Costa Ricans are Paraguayan (5.1%, a difference of 0.0%), Immigrants from Malaysia (5.1%, a difference of 0.090%), Hawaiian (5.1%, a difference of 0.10%), Sierra Leonean (5.1%, a difference of 0.34%), and Immigrants from Jordan (5.1%, a difference of 0.65%).
DemographicsRating | RankMarried-Couple Family Poverty
Pennsylvania Germans
68.5
/100
|
#160
Good
5.1%
Ethiopians
68.1
/100
|
#161
Good
5.1%
Immigrants from Jordan
66.5
/100
|
#162
Good
5.1%
Sierra Leoneans
64.1
/100
|
#163
Good
5.1%
Hawaiians
62.3
/100
|
#164
Good
5.1%
Immigrants from Malaysia
62.2
/100
|
#165
Good
5.1%
Paraguayans
61.5
/100
|
#166
Good
5.1%
Costa Ricans
61.5
/100
|
#167
Good
5.1%
Immigrants from Uganda
54.9
/100
|
#168
Average
5.2%
Ottawa
54.5
/100
|
#169
Average
5.2%
Immigrants from Argentina
54.4
/100
|
#170
Average
5.2%
Bermudans
52.9
/100
|
#171
Average
5.2%
Immigrants from Northern Africa
51.3
/100
|
#172
Average
5.2%
Alsatians
51.2
/100
|
#173
Average
5.2%
Immigrants from Eastern Africa
50.0
/100
|
#174
Average
5.2%

Costa Rican Married-Couple Family Poverty Correlation Summary

MeasurementCosta Rican DataMarried-Couple Family Poverty Data
Minimum0.054%0.54%
Maximum16.6%27.6%
Range16.5%27.0%
Mean4.2%6.0%
Median3.4%5.0%
Interquartile 25% (IQ1)1.7%3.5%
Interquartile 75% (IQ3)5.6%6.0%
Interquartile Range (IQR)3.9%2.5%
Standard Deviation (Sample)3.6%5.2%
Standard Deviation (Population)3.6%5.1%

Correlation Details

Costa Rican PercentileSample SizeMarried-Couple Family Poverty
[
0.0%
-
0.5%
]
0.054%
193,383,9765.5%
[
0.0%
-
0.5%
]
0.19%
35,157,0134.9%
[
0.0%
-
0.5%
]
0.33%
11,251,3485.3%
[
0.0%
-
0.5%
]
0.46%
4,929,2494.8%
[
0.5%
-
1.0%
]
0.59%
2,732,8034.6%
[
0.5%
-
1.0%
]
0.73%
1,703,9364.7%
[
0.5%
-
1.0%
]
0.87%
880,3525.3%
[
1.0%
-
1.5%
]
1.00%
643,4154.3%
[
1.0%
-
1.5%
]
1.13%
334,4035.4%
[
1.0%
-
1.5%
]
1.27%
287,6914.8%
[
1.0%
-
1.5%
]
1.41%
217,3783.5%
[
1.5%
-
2.0%
]
1.55%
123,3966.0%
[
1.5%
-
2.0%
]
1.68%
129,2575.7%
[
1.5%
-
2.0%
]
1.81%
71,2236.6%
[
1.5%
-
2.0%
]
1.93%
200,6614.5%
[
2.0%
-
2.5%
]
2.10%
88,6464.9%
[
2.0%
-
2.5%
]
2.22%
38,0984.5%
[
2.0%
-
2.5%
]
2.33%
28,1293.5%
[
2.5%
-
3.0%
]
2.54%
7,6445.1%
[
2.5%
-
3.0%
]
2.60%
42,8719.7%
[
2.5%
-
3.0%
]
2.74%
30,4385.0%
[
2.5%
-
3.0%
]
2.91%
70,5445.4%
[
3.0%
-
3.5%
]
3.01%
38,9352.4%
[
3.0%
-
3.5%
]
3.17%
1,9545.5%
[
3.0%
-
3.5%
]
3.35%
24,1788.4%
[
3.0%
-
3.5%
]
3.42%
10,6074.5%
[
3.5%
-
4.0%
]
3.71%
2,2926.0%
[
3.5%
-
4.0%
]
3.83%
21,5070.98%
[
3.5%
-
4.0%
]
3.96%
30,8663.5%
[
4.0%
-
4.5%
]
4.14%
8,9542.7%
[
4.0%
-
4.5%
]
4.41%
9,7811.1%
[
4.5%
-
5.0%
]
4.52%
9,1055.2%
[
4.5%
-
5.0%
]
4.65%
8611.8%
[
4.5%
-
5.0%
]
4.84%
3,3091.6%
[
5.0%
-
5.5%
]
5.10%
16,6025.9%
[
5.0%
-
5.5%
]
5.36%
6167.0%
[
5.0%
-
5.5%
]
5.42%
2771.9%
[
5.5%
-
6.0%
]
5.60%
1,5190.93%
[
5.5%
-
6.0%
]
5.85%
8,2871.3%
[
6.0%
-
6.5%
]
6.15%
1,59427.6%
[
6.0%
-
6.5%
]
6.22%
5,37315.7%
[
6.0%
-
6.5%
]
6.39%
5,22617.1%
[
7.0%
-
7.5%
]
7.29%
3985.9%
[
7.5%
-
8.0%
]
7.55%
1593.7%
[
8.0%
-
8.5%
]
8.23%
14,1730.54%
[
9.5%
-
10.0%
]
9.80%
11,9060.67%
[
10.0%
-
10.5%
]
10.07%
1,1327.4%
[
12.0%
-
12.5%
]
12.24%
989.5%
[
14.5%
-
15.0%
]
14.80%
4,77122.7%
[
16.5%
-
17.0%
]
16.60%
2532.6%