Costa Rican 4 or more Vehicles in Household

COMPARE

Costa Rican
Race
Ancestry
AfghanAfricanAlaska NativeAlaskan AthabascanAlbanianAleutAlsatianAmericanApacheArabArapahoArgentineanArmenianAssyrian/Chaldean/SyriacAustralianAustrianBahamianBangladeshiBarbadianBasqueBelgianBelizeanBermudanBhutaneseBlackfeetBolivianBrazilianBritishBritish West IndianBulgarianBurmeseCajunCambodianCanadianCape VerdeanCarpatho RusynCelticCentral AmericanCentral American IndianCherokeeCheyenneChickasawChileanChineseChippewaChoctawColombianColvilleComancheCosta RicanCreeCreekCroatianCrowCubanCypriotCzechCzechoslovakianDanishDelawareDominicanDutchDutch West IndianEastern EuropeanEcuadorianEgyptianEnglishEstonianEthiopianEuropeanFijianFilipinoFinnishFrenchFrench American IndianFrench CanadianGermanGerman RussianGhanaianGreekGuamanian/ChamorroGuatemalanGuyaneseHaitianHmongHonduranHopiHoumaHungarianIcelanderIndian (Asian)IndonesianInupiatIranianIraqiIrishIroquoisIsraeliItalianJamaicanJapaneseJordanianKenyanKiowaKoreanLaotianLatvianLebaneseLiberianLithuanianLumbeeLuxembourgerMacedonianMalaysianMalteseMarshalleseMenomineeMexicanMexican American IndianMongolianMoroccanNative HawaiianNavajoNepaleseNew ZealanderNicaraguanNigerianNorthern EuropeanNorwegianOkinawanOsageOttawaPaiutePakistaniPalestinianPanamanianParaguayanPennsylvania GermanPeruvianPimaPolishPortuguesePotawatomiPuebloPuerto RicanPuget Sound SalishRomanianRussianSalvadoranSamoanScandinavianScotch-IrishScottishSeminoleSenegaleseSerbianShoshoneSierra LeoneanSiouxSlavicSlovakSloveneSomaliSouth AfricanSouth AmericanSouth American IndianSoviet UnionSpaniardSpanishSpanish AmericanSpanish American IndianSri LankanSubsaharan AfricanSudaneseSwedishSwissSyrianTaiwaneseThaiTlingit-HaidaTohono O'OdhamTonganTrinidadian and TobagonianTsimshianTurkishU.S. Virgin IslanderUgandanUkrainianUruguayanUteVenezuelanVietnameseWelshWest IndianYakamaYaquiYugoslavianYumanYup'ikZimbabwean
Immigration
NonimmigrantsImmigrantsAfghanistanAfricaAlbaniaArgentinaArmeniaAsiaAustraliaAustriaBahamasBangladeshBarbadosBelarusBelgiumBelizeBoliviaBosnia and HerzegovinaBrazilBulgariaBurma/MyanmarCabo VerdeCambodiaCameroonCanadaCaribbeanCentral AmericaChileChinaColombiaCongoCosta RicaCroatiaCubaCzechoslovakiaDenmarkDominicaDominican RepublicEastern AfricaEastern AsiaEastern EuropeEcuadorEgyptEl SalvadorEnglandEritreaEthiopiaEuropeFijiFranceGermanyGhanaGreeceGrenadaGuatemalaGuyanaHaitiHondurasHong KongHungaryIndiaIndonesiaIranIraqIrelandIsraelItalyJamaicaJapanJordanKazakhstanKenyaKoreaKuwaitLaosLatin AmericaLatviaLebanonLiberiaLithuaniaMalaysiaMexicoMicronesiaMiddle AfricaMoldovaMoroccoNepalNetherlandsNicaraguaNigeriaNorth AmericaNorth MacedoniaNorthern AfricaNorthern EuropeNorwayOceaniaPakistanPanamaPeruPhilippinesPolandPortugalRomaniaRussiaSaudi ArabiaScotlandSenegalSerbiaSierra LeoneSingaporeSomaliaSouth AfricaSouth AmericaSouth Central AsiaSouth Eastern AsiaSouthern EuropeSpainSri LankaSt. Vincent and the GrenadinesSudanSwedenSwitzerlandSyriaTaiwanThailandTrinidad and TobagoTurkeyUgandaUkraineUruguayUzbekistanVenezuelaVietnamWest IndiesWestern AfricaWestern AsiaWestern EuropeYemenZaireZimbabweAzores
Select to Compare
Race
Ancestry
AfghanAfricanAlaska NativeAlaskan AthabascanAlbanianAleutAlsatianAmericanApacheArabArapahoArgentineanArmenianAssyrian/Chaldean/SyriacAustralianAustrianBahamianBangladeshiBarbadianBasqueBelgianBelizeanBermudanBhutaneseBlackfeetBolivianBrazilianBritishBritish West IndianBulgarianBurmeseCajunCambodianCanadianCape VerdeanCarpatho RusynCelticCentral AmericanCentral American IndianCherokeeCheyenneChickasawChileanChineseChippewaChoctawColombianColvilleComancheCreeCreekCroatianCrowCubanCypriotCzechCzechoslovakianDanishDelawareDominicanDutchDutch West IndianEastern EuropeanEcuadorianEgyptianEnglishEstonianEthiopianEuropeanFijianFilipinoFinnishFrenchFrench American IndianFrench CanadianGermanGerman RussianGhanaianGreekGuamanian/ChamorroGuatemalanGuyaneseHaitianHmongHonduranHopiHoumaHungarianIcelanderIndian (Asian)IndonesianInupiatIranianIraqiIrishIroquoisIsraeliItalianJamaicanJapaneseJordanianKenyanKiowaKoreanLaotianLatvianLebaneseLiberianLithuanianLumbeeLuxembourgerMacedonianMalaysianMalteseMarshalleseMenomineeMexicanMexican American IndianMongolianMoroccanNative HawaiianNavajoNepaleseNew ZealanderNicaraguanNigerianNorthern EuropeanNorwegianOkinawanOsageOttawaPaiutePakistaniPalestinianPanamanianParaguayanPennsylvania GermanPeruvianPimaPolishPortuguesePotawatomiPuebloPuerto RicanPuget Sound SalishRomanianRussianSalvadoranSamoanScandinavianScotch-IrishScottishSeminoleSenegaleseSerbianShoshoneSierra LeoneanSiouxSlavicSlovakSloveneSomaliSouth AfricanSouth AmericanSouth American IndianSoviet UnionSpaniardSpanishSpanish AmericanSpanish American IndianSri LankanSubsaharan AfricanSudaneseSwedishSwissSyrianTaiwaneseThaiTlingit-HaidaTohono O'OdhamTonganTrinidadian and TobagonianTsimshianTurkishU.S. Virgin IslanderUgandanUkrainianUruguayanUteVenezuelanVietnameseWelshWest IndianYakamaYaquiYugoslavianYumanYup'ikZimbabwean
Immigration
NonimmigrantsImmigrantsAfghanistanAfricaAlbaniaArgentinaArmeniaAsiaAustraliaAustriaBahamasBangladeshBarbadosBelarusBelgiumBelizeBoliviaBosnia and HerzegovinaBrazilBulgariaBurma/MyanmarCabo VerdeCambodiaCameroonCanadaCaribbeanCentral AmericaChileChinaColombiaCongoCosta RicaCroatiaCubaCzechoslovakiaDenmarkDominicaDominican RepublicEastern AfricaEastern AsiaEastern EuropeEcuadorEgyptEl SalvadorEnglandEritreaEthiopiaEuropeFijiFranceGermanyGhanaGreeceGrenadaGuatemalaGuyanaHaitiHondurasHong KongHungaryIndiaIndonesiaIranIraqIrelandIsraelItalyJamaicaJapanJordanKazakhstanKenyaKoreaKuwaitLaosLatin AmericaLatviaLebanonLiberiaLithuaniaMalaysiaMexicoMicronesiaMiddle AfricaMoldovaMoroccoNepalNetherlandsNicaraguaNigeriaNorth AmericaNorth MacedoniaNorthern AfricaNorthern EuropeNorwayOceaniaPakistanPanamaPeruPhilippinesPolandPortugalRomaniaRussiaSaudi ArabiaScotlandSenegalSerbiaSierra LeoneSingaporeSomaliaSouth AfricaSouth AmericaSouth Central AsiaSouth Eastern AsiaSouthern EuropeSpainSri LankaSt. Vincent and the GrenadinesSudanSwedenSwitzerlandSyriaTaiwanThailandTrinidad and TobagoTurkeyUgandaUkraineUruguayUzbekistanVenezuelaVietnamWest IndiesWestern AfricaWestern AsiaWestern EuropeYemenZaireZimbabweAzores
4 or more Vehicles in Household
Income
Poverty
Unemployment
Labor Participation
Family Structure
Vehicle Availability
Education Level
Disability

Costa Rican 4 or more Vehicles in Household
Exceptional

6.8%
4+ VEHICLES AVAILABLE
95.5/ 100
METRIC RATING
119th/ 347
METRIC RANK

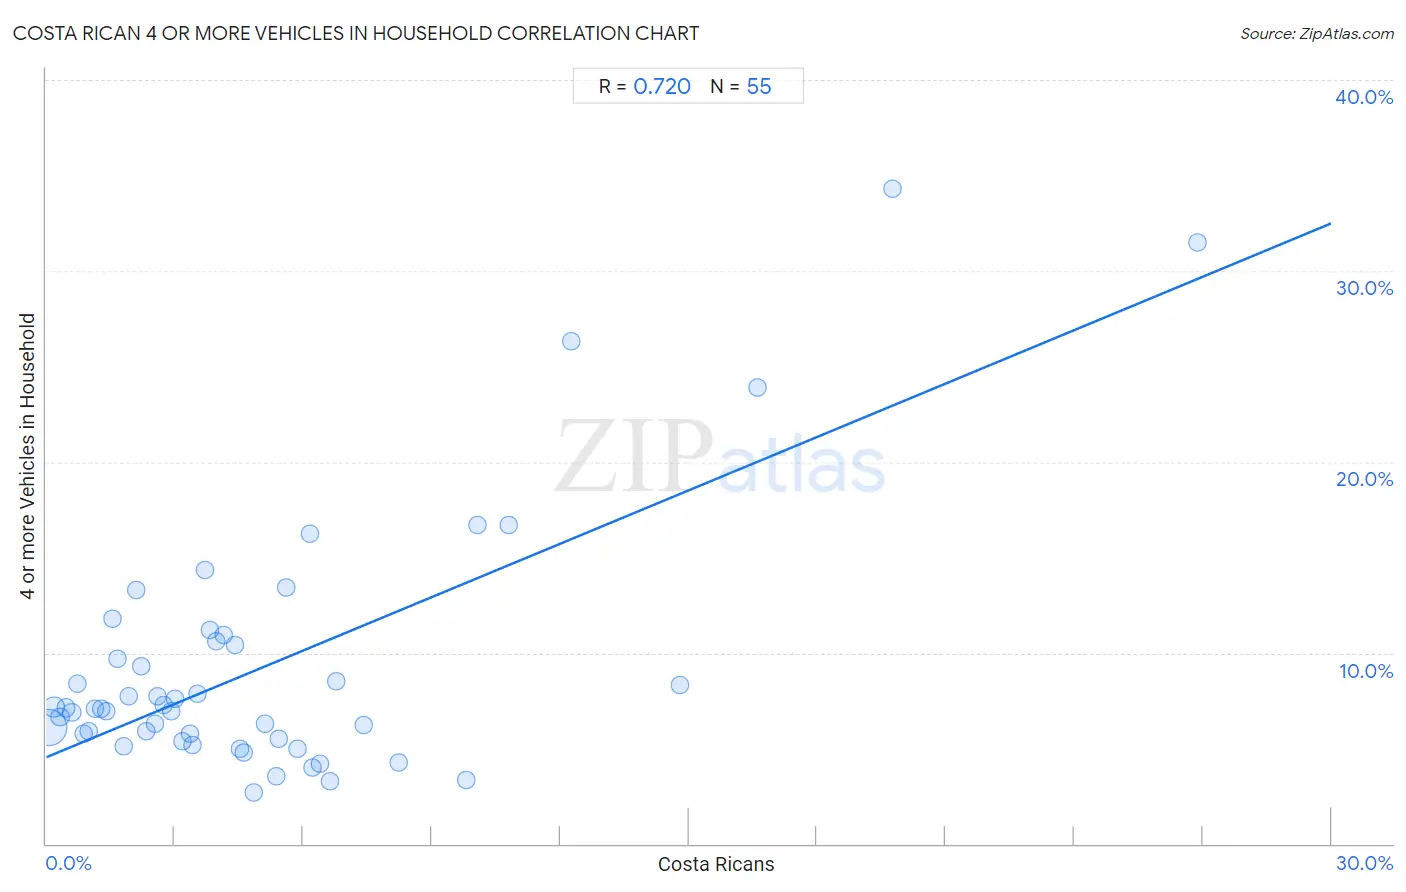
Costa Rican 4 or more Vehicles in Household Correlation Chart

The statistical analysis conducted on geographies consisting of 252,442,983 people shows a strong positive correlation between the proportion of Costa Ricans and percentage of households with 4 or more vehicles available in the United States with a correlation coefficient (R) of 0.720 and weighted average of 6.8%. On average, for every 1% (one percent) increase in Costa Ricans within a typical geography, there is an increase of 0.93% in percentage of households with 4 or more vehicles available.
Costa Rican 4 or more Vehicles in Household
It is essential to understand that the correlation between the percentage of Costa Ricans and percentage of households with 4 or more vehicles available does not imply a direct cause-and-effect relationship. It remains uncertain whether the presence of Costa Ricans influences an upward or downward trend in the level of percentage of households with 4 or more vehicles available within an area, or if Costa Ricans simply ended up residing in those areas with higher or lower levels of percentage of households with 4 or more vehicles available due to other factors.

Demographics Similar to Costa Ricans by 4 or more Vehicles in Household

In terms of 4 or more vehicles in household, the demographic groups most similar to Costa Ricans are Burmese (6.8%, a difference of 0.11%), French American Indian (6.8%, a difference of 0.11%), Immigrants from Guatemala (6.8%, a difference of 0.13%), Comanche (6.8%, a difference of 0.36%), and Tlingit-Haida (6.8%, a difference of 0.39%).
DemographicsRating | Rank4 or more Vehicles in Household
Hopi
97.0
/100
|
#112
Exceptional
6.9%
Canadians
96.4
/100
|
#113
Exceptional
6.9%
Bolivians
96.3
/100
|
#114
Exceptional
6.8%
Tlingit-Haida
96.2
/100
|
#115
Exceptional
6.8%
Immigrants from Guatemala
95.8
/100
|
#116
Exceptional
6.8%
Burmese
95.7
/100
|
#117
Exceptional
6.8%
French American Indians
95.7
/100
|
#118
Exceptional
6.8%
Costa Ricans
95.5
/100
|
#119
Exceptional
6.8%
Comanche
94.8
/100
|
#120
Exceptional
6.8%
Immigrants from Germany
94.7
/100
|
#121
Exceptional
6.8%
Immigrants from Nicaragua
94.7
/100
|
#122
Exceptional
6.8%
Immigrants
94.6
/100
|
#123
Exceptional
6.8%
Immigrants from Asia
94.4
/100
|
#124
Exceptional
6.8%
Austrians
94.1
/100
|
#125
Exceptional
6.8%
Belgians
94.1
/100
|
#126
Exceptional
6.8%

Costa Rican 4 or more Vehicles in Household Correlation Summary

MeasurementCosta Rican Data4 or more Vehicles in Household Data
Minimum0.054%2.7%
Maximum26.9%34.3%
Range26.8%31.6%
Mean5.1%9.3%
Median3.7%7.1%
Interquartile 25% (IQ1)1.8%5.5%
Interquartile 75% (IQ3)6.2%10.6%
Interquartile Range (IQR)4.4%5.1%
Standard Deviation (Sample)5.1%6.6%
Standard Deviation (Population)5.0%6.5%

Correlation Details

Costa Rican PercentileSample Size4 or more Vehicles in Household
[
0.0%
-
0.5%
]
0.054%
192,849,1946.1%
[
0.0%
-
0.5%
]
0.19%
35,276,6357.2%
[
0.0%
-
0.5%
]
0.33%
11,289,4636.6%
[
0.0%
-
0.5%
]
0.46%
4,971,8697.1%
[
0.5%
-
1.0%
]
0.59%
2,795,0116.9%
[
0.5%
-
1.0%
]
0.73%
1,715,9088.4%
[
0.5%
-
1.0%
]
0.87%
873,4865.7%
[
1.0%
-
1.5%
]
1.00%
645,7785.9%
[
1.0%
-
1.5%
]
1.13%
350,0017.1%
[
1.0%
-
1.5%
]
1.28%
323,2307.1%
[
1.0%
-
1.5%
]
1.41%
218,5656.9%
[
1.5%
-
2.0%
]
1.55%
139,21911.8%
[
1.5%
-
2.0%
]
1.68%
143,8169.7%
[
1.5%
-
2.0%
]
1.81%
73,5475.1%
[
1.5%
-
2.0%
]
1.93%
202,3557.7%
[
2.0%
-
2.5%
]
2.10%
90,54813.3%
[
2.0%
-
2.5%
]
2.22%
38,3299.3%
[
2.0%
-
2.5%
]
2.33%
33,2935.9%
[
2.5%
-
3.0%
]
2.54%
7,7666.3%
[
2.5%
-
3.0%
]
2.60%
45,7657.7%
[
2.5%
-
3.0%
]
2.74%
30,4387.2%
[
2.5%
-
3.0%
]
2.91%
70,9516.9%
[
3.0%
-
3.5%
]
3.01%
40,3217.6%
[
3.0%
-
3.5%
]
3.19%
8,2665.4%
[
3.0%
-
3.5%
]
3.35%
24,1785.8%
[
3.0%
-
3.5%
]
3.42%
12,6495.2%
[
3.5%
-
4.0%
]
3.53%
1,2737.9%
[
3.5%
-
4.0%
]
3.71%
2,29214.3%
[
3.5%
-
4.0%
]
3.83%
21,50711.2%
[
3.5%
-
4.0%
]
3.96%
30,86610.6%
[
4.0%
-
4.5%
]
4.14%
8,95411.0%
[
4.0%
-
4.5%
]
4.41%
9,78110.4%
[
4.5%
-
5.0%
]
4.52%
9,1054.9%
[
4.5%
-
5.0%
]
4.60%
5874.8%
[
4.5%
-
5.0%
]
4.84%
3,3092.7%
[
5.0%
-
5.5%
]
5.10%
16,6026.3%
[
5.0%
-
5.5%
]
5.36%
6163.6%
[
5.0%
-
5.5%
]
5.42%
2775.5%
[
5.5%
-
6.0%
]
5.60%
1,51913.5%
[
5.5%
-
6.0%
]
5.85%
8,2875.0%
[
6.0%
-
6.5%
]
6.15%
1,59416.2%
[
6.0%
-
6.5%
]
6.22%
5,3734.0%
[
6.0%
-
6.5%
]
6.39%
5,2264.2%
[
6.5%
-
7.0%
]
6.61%
9,6763.3%
[
6.5%
-
7.0%
]
6.78%
9158.5%
[
7.0%
-
7.5%
]
7.41%
2976.2%
[
8.0%
-
8.5%
]
8.24%
14,7784.3%
[
9.5%
-
10.0%
]
9.80%
11,9063.4%
[
10.0%
-
10.5%
]
10.07%
1,13216.7%
[
10.5%
-
11.0%
]
10.81%
65716.7%
[
12.0%
-
12.5%
]
12.24%
9826.3%
[
14.5%
-
15.0%
]
14.80%
4,7718.3%
[
16.5%
-
17.0%
]
16.60%
25323.9%
[
19.5%
-
20.0%
]
19.76%
16734.3%
[
26.5%
-
27.0%
]
26.88%
58431.5%