Chippewa Unemployment Among Women with Children Ages 6 to 17 years
COMPARE
Chippewa
Select to Compare
Unemployment Among Women with Children Ages 6 to 17 years
Chippewa Unemployment Among Women with Children Ages 6 to 17 years
11.1%
UNEMPLOYMENT | WOMEN W/ CHILDREN 6 TO 17
0.0/ 100
METRIC RATING
330th/ 347
METRIC RANK
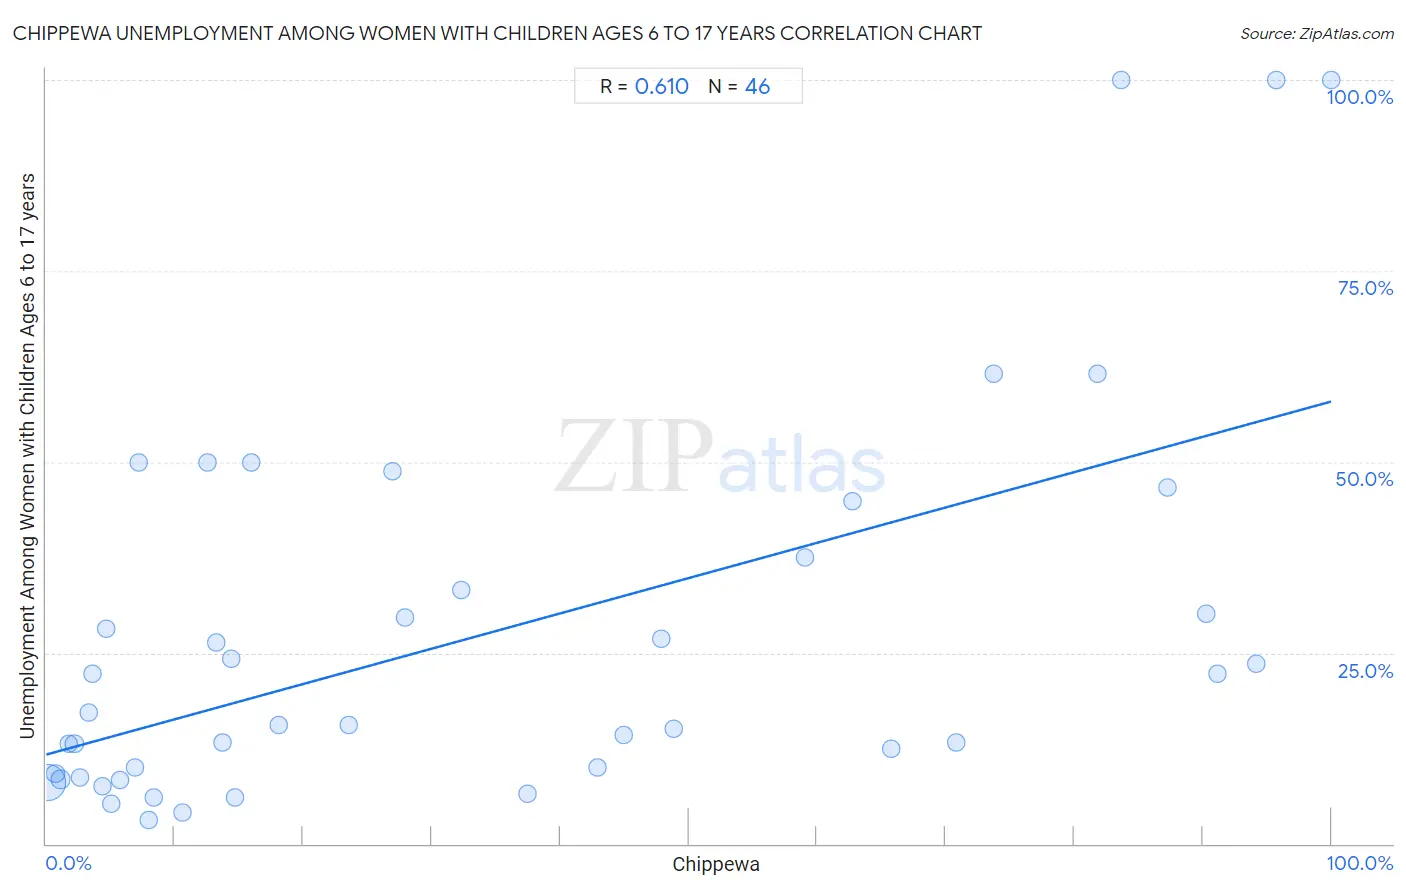
Chippewa Unemployment Among Women with Children Ages 6 to 17 years Correlation Chart
The statistical analysis conducted on geographies consisting of 165,586,113 people shows a significant positive correlation between the proportion of Chippewa and unemployment rate among women with children between the ages 6 and 17 in the United States with a correlation coefficient (R) of 0.610 and weighted average of 11.1%. On average, for every 1% (one percent) increase in Chippewa within a typical geography, there is an increase of 0.46% in unemployment rate among women with children between the ages 6 and 17.
It is essential to understand that the correlation between the percentage of Chippewa and unemployment rate among women with children between the ages 6 and 17 does not imply a direct cause-and-effect relationship. It remains uncertain whether the presence of Chippewa influences an upward or downward trend in the level of unemployment rate among women with children between the ages 6 and 17 within an area, or if Chippewa simply ended up residing in those areas with higher or lower levels of unemployment rate among women with children between the ages 6 and 17 due to other factors.
Demographics Similar to Chippewa by Unemployment Among Women with Children Ages 6 to 17 years
In terms of unemployment among women with children ages 6 to 17 years, the demographic groups most similar to Chippewa are Pennsylvania German (11.0%, a difference of 0.48%), Ottawa (10.9%, a difference of 2.0%), Cape Verdean (10.9%, a difference of 2.1%), Liberian (10.8%, a difference of 2.2%), and Cajun (10.8%, a difference of 2.2%).
| Demographics | Rating | Rank | Unemployment Among Women with Children Ages 6 to 17 years |
| Dominicans | 0.0 /100 | #323 | Tragic 10.8% |
| Immigrants from Dominican Republic | 0.0 /100 | #324 | Tragic 10.8% |
| Cajuns | 0.0 /100 | #325 | Tragic 10.8% |
| Liberians | 0.0 /100 | #326 | Tragic 10.8% |
| Cape Verdeans | 0.0 /100 | #327 | Tragic 10.9% |
| Ottawa | 0.0 /100 | #328 | Tragic 10.9% |
| Pennsylvania Germans | 0.0 /100 | #329 | Tragic 11.0% |
| Chippewa | 0.0 /100 | #330 | Tragic 11.1% |
| Blacks/African Americans | 0.0 /100 | #331 | Tragic 11.4% |
| Tsimshian | 0.0 /100 | #332 | Tragic 11.4% |
| Natives/Alaskans | 0.0 /100 | #333 | Tragic 11.5% |
| Ugandans | 0.0 /100 | #334 | Tragic 12.0% |
| Colville | 0.0 /100 | #335 | Tragic 12.3% |
| Houma | 0.0 /100 | #336 | Tragic 12.5% |
| Immigrants from Yemen | 0.0 /100 | #337 | Tragic 12.7% |
Chippewa Unemployment Among Women with Children Ages 6 to 17 years Correlation Summary
| Measurement | Chippewa Data | Unemployment Among Women with Children Ages 6 to 17 years Data |
| Minimum | 0.054% | 3.1% |
| Maximum | 100.0% | 100.0% |
| Range | 99.9% | 96.9% |
| Mean | 34.1% | 27.4% |
| Median | 17.0% | 16.4% |
| Interquartile 25% (IQ1) | 5.7% | 9.2% |
| Interquartile 75% (IQ3) | 62.8% | 37.5% |
| Interquartile Range (IQR) | 57.1% | 28.3% |
| Standard Deviation (Sample) | 33.2% | 25.2% |
| Standard Deviation (Population) | 32.8% | 24.9% |
Correlation Details
| Chippewa Percentile | Sample Size | Unemployment Among Women with Children Ages 6 to 17 years |
[ 0.0% - 0.5% ] 0.054% | 160,776,092 | 8.1% |
[ 0.5% - 1.0% ] 0.70% | 3,206,133 | 9.2% |
[ 1.0% - 1.5% ] 1.12% | 815,370 | 8.4% |
[ 1.5% - 2.0% ] 1.77% | 144,500 | 13.2% |
[ 2.0% - 2.5% ] 2.19% | 196,810 | 13.1% |
[ 2.5% - 3.0% ] 2.61% | 185,208 | 8.7% |
[ 3.0% - 3.5% ] 3.28% | 68,204 | 17.1% |
[ 3.5% - 4.0% ] 3.64% | 30,446 | 22.2% |
[ 4.0% - 4.5% ] 4.37% | 44,292 | 7.5% |
[ 4.5% - 5.0% ] 4.63% | 2,161 | 28.1% |
[ 5.0% - 5.5% ] 5.04% | 3,351 | 5.2% |
[ 5.5% - 6.0% ] 5.69% | 8,306 | 8.3% |
[ 6.5% - 7.0% ] 6.88% | 320 | 10.0% |
[ 7.0% - 7.5% ] 7.18% | 1,672 | 50.0% |
[ 7.5% - 8.0% ] 7.99% | 12,559 | 3.1% |
[ 8.0% - 8.5% ] 8.41% | 3,983 | 6.1% |
[ 10.5% - 11.0% ] 10.61% | 29,000 | 4.0% |
[ 12.5% - 13.0% ] 12.57% | 382 | 50.0% |
[ 13.0% - 13.5% ] 13.20% | 4,938 | 26.4% |
[ 13.5% - 14.0% ] 13.74% | 1,871 | 13.3% |
[ 14.0% - 14.5% ] 14.35% | 1,115 | 24.3% |
[ 14.5% - 15.0% ] 14.71% | 3,889 | 6.1% |
[ 15.5% - 16.0% ] 15.98% | 707 | 50.0% |
[ 18.0% - 18.5% ] 18.08% | 4,309 | 15.6% |
[ 23.5% - 24.0% ] 23.56% | 3,290 | 15.6% |
[ 26.5% - 27.0% ] 26.93% | 3,628 | 48.8% |
[ 27.5% - 28.0% ] 27.92% | 4,499 | 29.6% |
[ 32.0% - 32.5% ] 32.26% | 248 | 33.3% |
[ 37.0% - 37.5% ] 37.44% | 6,234 | 6.5% |
[ 42.5% - 43.0% ] 42.90% | 1,275 | 10.0% |
[ 44.5% - 45.0% ] 44.99% | 2,863 | 14.3% |
[ 47.5% - 48.0% ] 47.82% | 1,190 | 26.9% |
[ 48.5% - 49.0% ] 48.84% | 6,323 | 15.0% |
[ 59.0% - 59.5% ] 59.07% | 237 | 37.5% |
[ 62.5% - 63.0% ] 62.77% | 505 | 44.8% |
[ 65.5% - 66.0% ] 65.71% | 525 | 12.5% |
[ 70.5% - 71.0% ] 70.82% | 2,940 | 13.2% |
[ 73.5% - 74.0% ] 73.74% | 613 | 61.5% |
[ 81.5% - 82.0% ] 81.78% | 472 | 61.5% |
[ 83.5% - 84.0% ] 83.68% | 190 | 100.0% |
[ 87.0% - 87.5% ] 87.29% | 299 | 46.7% |
[ 90.0% - 90.5% ] 90.28% | 895 | 30.2% |
[ 91.0% - 91.5% ] 91.13% | 203 | 22.2% |
[ 94.0% - 94.5% ] 94.16% | 2,960 | 23.6% |
[ 95.5% - 96.0% ] 95.75% | 1,011 | 100.0% |
[ 99.5% - 100.0% ] 100.00% | 95 | 100.0% |