Chippewa Married-couple Households
COMPARE
Chippewa
Select to Compare
Married-couple Households
Chippewa Married-couple Households
42.1%
MARRIED-COUPLE HOUSEHOLDS
0.0/ 100
METRIC RATING
287th/ 347
METRIC RANK
Chippewa Married-couple Households Correlation Chart
The statistical analysis conducted on geographies consisting of 214,993,605 people shows a significant negative correlation between the proportion of Chippewa and percentage of married-couple family households in the United States with a correlation coefficient (R) of -0.640 and weighted average of 42.1%. On average, for every 1% (one percent) increase in Chippewa within a typical geography, there is a decrease of 0.29% in percentage of married-couple family households.
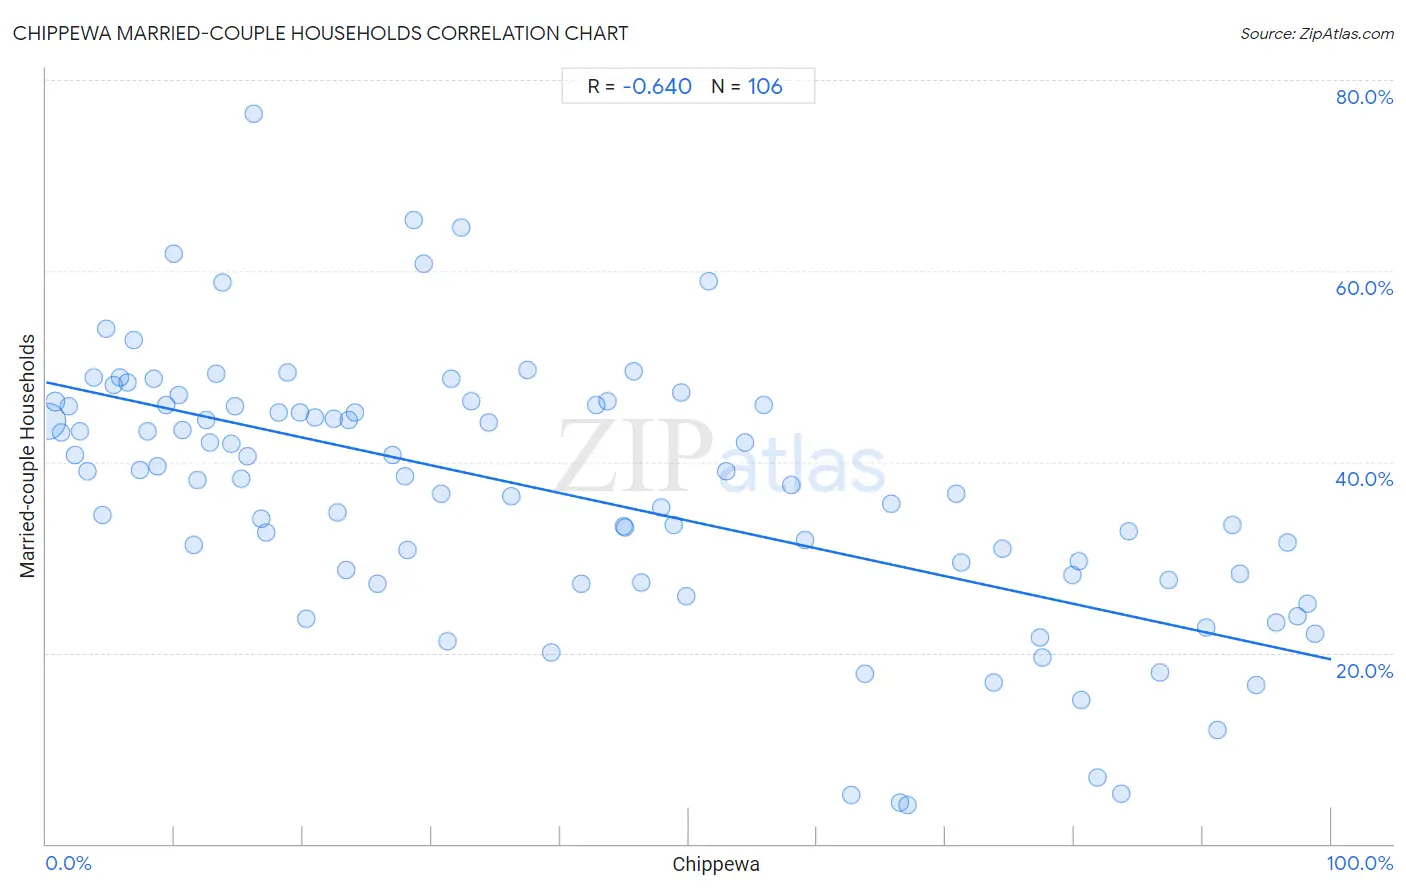
It is essential to understand that the correlation between the percentage of Chippewa and percentage of married-couple family households does not imply a direct cause-and-effect relationship. It remains uncertain whether the presence of Chippewa influences an upward or downward trend in the level of percentage of married-couple family households within an area, or if Chippewa simply ended up residing in those areas with higher or lower levels of percentage of married-couple family households due to other factors.
Demographics Similar to Chippewa by Married-couple Households
In terms of married-couple households, the demographic groups most similar to Chippewa are Immigrants from Eritrea (42.1%, a difference of 0.080%), Sudanese (42.1%, a difference of 0.14%), Honduran (42.1%, a difference of 0.19%), Paiute (42.1%, a difference of 0.20%), and Belizean (42.2%, a difference of 0.24%).
| Demographics | Rating | Rank | Married-couple Households |
| Immigrants from Ecuador | 0.0 /100 | #280 | Tragic 42.9% |
| Immigrants from Guatemala | 0.0 /100 | #281 | Tragic 42.8% |
| Bermudans | 0.0 /100 | #282 | Tragic 42.4% |
| Inupiat | 0.0 /100 | #283 | Tragic 42.4% |
| Cheyenne | 0.0 /100 | #284 | Tragic 42.3% |
| Ghanaians | 0.0 /100 | #285 | Tragic 42.2% |
| Belizeans | 0.0 /100 | #286 | Tragic 42.2% |
| Chippewa | 0.0 /100 | #287 | Tragic 42.1% |
| Immigrants from Eritrea | 0.0 /100 | #288 | Tragic 42.1% |
| Sudanese | 0.0 /100 | #289 | Tragic 42.1% |
| Hondurans | 0.0 /100 | #290 | Tragic 42.1% |
| Paiute | 0.0 /100 | #291 | Tragic 42.1% |
| Indonesians | 0.0 /100 | #292 | Tragic 42.0% |
| Menominee | 0.0 /100 | #293 | Tragic 42.0% |
| Immigrants from Yemen | 0.0 /100 | #294 | Tragic 42.0% |
Chippewa Married-couple Households Correlation Summary
| Measurement | Chippewa Data | Married-couple Households Data |
| Minimum | 0.066% | 4.0% |
| Maximum | 98.7% | 76.5% |
| Range | 98.7% | 72.5% |
| Mean | 39.7% | 36.8% |
| Median | 31.4% | 38.4% |
| Interquartile 25% (IQ1) | 13.2% | 28.2% |
| Interquartile 75% (IQ3) | 65.8% | 45.9% |
| Interquartile Range (IQR) | 52.6% | 17.7% |
| Standard Deviation (Sample) | 30.4% | 13.8% |
| Standard Deviation (Population) | 30.2% | 13.7% |
Correlation Details
| Chippewa Percentile | Sample Size | Married-couple Households |
[ 0.0% - 0.5% ] 0.066% | 204,775,257 | 44.3% |
[ 0.5% - 1.0% ] 0.70% | 6,229,493 | 46.3% |
[ 1.0% - 1.5% ] 1.16% | 1,914,355 | 43.1% |
[ 1.5% - 2.0% ] 1.72% | 540,897 | 45.8% |
[ 2.0% - 2.5% ] 2.21% | 427,456 | 40.7% |
[ 2.5% - 3.0% ] 2.65% | 352,171 | 43.2% |
[ 3.0% - 3.5% ] 3.25% | 128,554 | 39.1% |
[ 3.5% - 4.0% ] 3.72% | 98,406 | 48.9% |
[ 4.0% - 4.5% ] 4.34% | 85,671 | 34.4% |
[ 4.5% - 5.0% ] 4.66% | 45,955 | 53.9% |
[ 5.0% - 5.5% ] 5.21% | 22,536 | 48.1% |
[ 5.5% - 6.0% ] 5.72% | 17,643 | 48.8% |
[ 6.0% - 6.5% ] 6.29% | 4,692 | 48.3% |
[ 6.5% - 7.0% ] 6.78% | 9,923 | 52.8% |
[ 7.0% - 7.5% ] 7.32% | 16,530 | 39.1% |
[ 7.5% - 8.0% ] 7.84% | 22,486 | 43.2% |
[ 8.0% - 8.5% ] 8.38% | 5,989 | 48.7% |
[ 8.5% - 9.0% ] 8.70% | 4,301 | 39.6% |
[ 9.0% - 9.5% ] 9.35% | 41,486 | 46.0% |
[ 9.5% - 10.0% ] 9.91% | 797 | 61.8% |
[ 10.0% - 10.5% ] 10.27% | 15,061 | 47.0% |
[ 10.5% - 11.0% ] 10.65% | 37,844 | 43.4% |
[ 11.0% - 11.5% ] 11.44% | 18,611 | 31.3% |
[ 11.5% - 12.0% ] 11.73% | 2,489 | 38.0% |
[ 12.0% - 12.5% ] 12.42% | 161 | 44.4% |
[ 12.5% - 13.0% ] 12.70% | 8,316 | 42.0% |
[ 13.0% - 13.5% ] 13.20% | 7,689 | 49.3% |
[ 13.5% - 14.0% ] 13.68% | 2,448 | 58.8% |
[ 14.0% - 14.5% ] 14.35% | 1,115 | 41.9% |
[ 14.5% - 15.0% ] 14.65% | 16,835 | 45.9% |
[ 15.0% - 15.5% ] 15.20% | 2,480 | 38.3% |
[ 15.5% - 16.0% ] 15.64% | 21,274 | 40.6% |
[ 16.0% - 16.5% ] 16.13% | 31 | 76.5% |
[ 16.5% - 17.0% ] 16.76% | 16,587 | 34.1% |
[ 17.0% - 17.5% ] 17.11% | 2,390 | 32.7% |
[ 18.0% - 18.5% ] 18.09% | 4,482 | 45.2% |
[ 18.5% - 19.0% ] 18.73% | 3,433 | 49.4% |
[ 19.5% - 20.0% ] 19.72% | 3,823 | 45.1% |
[ 20.0% - 20.5% ] 20.20% | 99 | 23.5% |
[ 20.5% - 21.0% ] 20.92% | 196 | 44.6% |
[ 22.0% - 22.5% ] 22.35% | 434 | 44.5% |
[ 22.5% - 23.0% ] 22.69% | 1,062 | 34.7% |
[ 23.0% - 23.5% ] 23.39% | 171 | 28.7% |
[ 23.5% - 24.0% ] 23.56% | 3,290 | 44.4% |
[ 24.0% - 24.5% ] 24.03% | 795 | 45.2% |
[ 25.5% - 26.0% ] 25.81% | 31 | 27.3% |
[ 26.5% - 27.0% ] 26.93% | 3,628 | 40.7% |
[ 27.5% - 28.0% ] 27.92% | 4,499 | 38.4% |
[ 28.0% - 28.5% ] 28.15% | 2,504 | 30.8% |
[ 28.5% - 29.0% ] 28.57% | 119 | 65.4% |
[ 29.0% - 29.5% ] 29.41% | 119 | 60.8% |
[ 30.5% - 31.0% ] 30.72% | 153 | 36.7% |
[ 31.0% - 31.5% ] 31.25% | 112 | 21.2% |
[ 31.5% - 32.0% ] 31.50% | 873 | 48.7% |
[ 32.0% - 32.5% ] 32.29% | 319 | 64.6% |
[ 33.0% - 33.5% ] 33.11% | 1,178 | 46.3% |
[ 34.0% - 34.5% ] 34.48% | 406 | 44.1% |
[ 36.0% - 36.5% ] 36.21% | 116 | 36.4% |
[ 37.0% - 37.5% ] 37.44% | 6,234 | 49.6% |
[ 39.0% - 39.5% ] 39.29% | 28 | 20.0% |
[ 41.5% - 42.0% ] 41.67% | 96 | 27.3% |
[ 42.5% - 43.0% ] 42.81% | 1,731 | 45.9% |
[ 43.5% - 44.0% ] 43.65% | 575 | 46.3% |
[ 44.5% - 45.0% ] 44.98% | 3,079 | 33.3% |
[ 45.0% - 45.5% ] 45.03% | 382 | 33.1% |
[ 45.5% - 46.0% ] 45.68% | 1,819 | 49.6% |
[ 46.0% - 46.5% ] 46.30% | 972 | 27.3% |
[ 47.5% - 48.0% ] 47.82% | 1,838 | 35.2% |
[ 48.5% - 49.0% ] 48.84% | 6,540 | 33.4% |
[ 49.0% - 49.5% ] 49.39% | 494 | 47.3% |
[ 49.5% - 50.0% ] 49.83% | 299 | 25.9% |
[ 51.5% - 52.0% ] 51.53% | 1,011 | 58.9% |
[ 52.5% - 53.0% ] 52.88% | 2,969 | 39.0% |
[ 54.0% - 54.5% ] 54.37% | 607 | 42.1% |
[ 55.5% - 56.0% ] 55.80% | 776 | 46.0% |
[ 57.5% - 58.0% ] 57.97% | 395 | 37.6% |
[ 59.0% - 59.5% ] 59.07% | 237 | 31.8% |
[ 62.5% - 63.0% ] 62.67% | 1,776 | 5.1% |
[ 63.5% - 64.0% ] 63.75% | 1,854 | 17.9% |
[ 65.5% - 66.0% ] 65.79% | 839 | 35.6% |
[ 66.0% - 66.5% ] 66.47% | 683 | 4.4% |
[ 66.5% - 67.0% ] 66.98% | 733 | 4.0% |
[ 70.5% - 71.0% ] 70.82% | 2,940 | 36.7% |
[ 71.0% - 71.5% ] 71.23% | 146 | 29.4% |
[ 73.5% - 74.0% ] 73.74% | 613 | 16.8% |
[ 74.0% - 74.5% ] 74.43% | 219 | 30.9% |
[ 77.0% - 77.5% ] 77.29% | 1,026 | 21.7% |
[ 77.5% - 78.0% ] 77.56% | 2,117 | 19.6% |
[ 79.5% - 80.0% ] 79.88% | 323 | 28.2% |
[ 80.0% - 80.5% ] 80.36% | 550 | 29.6% |
[ 80.5% - 81.0% ] 80.56% | 108 | 15.1% |
[ 81.5% - 82.0% ] 81.78% | 472 | 6.9% |
[ 83.5% - 84.0% ] 83.68% | 190 | 5.3% |
[ 84.0% - 84.5% ] 84.28% | 318 | 32.8% |
[ 86.5% - 87.0% ] 86.67% | 285 | 18.0% |
[ 87.0% - 87.5% ] 87.40% | 2,071 | 27.7% |
[ 90.0% - 90.5% ] 90.28% | 895 | 22.7% |
[ 91.0% - 91.5% ] 91.13% | 203 | 12.0% |
[ 92.0% - 92.5% ] 92.31% | 39 | 33.3% |
[ 92.5% - 93.0% ] 92.90% | 7,355 | 28.2% |
[ 94.0% - 94.5% ] 94.16% | 2,960 | 16.6% |
[ 95.5% - 96.0% ] 95.75% | 1,011 | 23.2% |
[ 96.5% - 97.0% ] 96.58% | 789 | 31.5% |
[ 97.0% - 97.5% ] 97.42% | 852 | 23.8% |
[ 98.0% - 98.5% ] 98.17% | 1,202 | 25.1% |
[ 98.5% - 99.0% ] 98.73% | 1,183 | 22.0% |