Chippewa Married-Couple Family Poverty
COMPARE
Chippewa
Select to Compare
Married-Couple Family Poverty
Chippewa Married-Couple Family Poverty
5.4%
POVERTY | MARRIED-COUPLE FAMILIES
18.9/ 100
METRIC RATING
205th/ 347
METRIC RANK
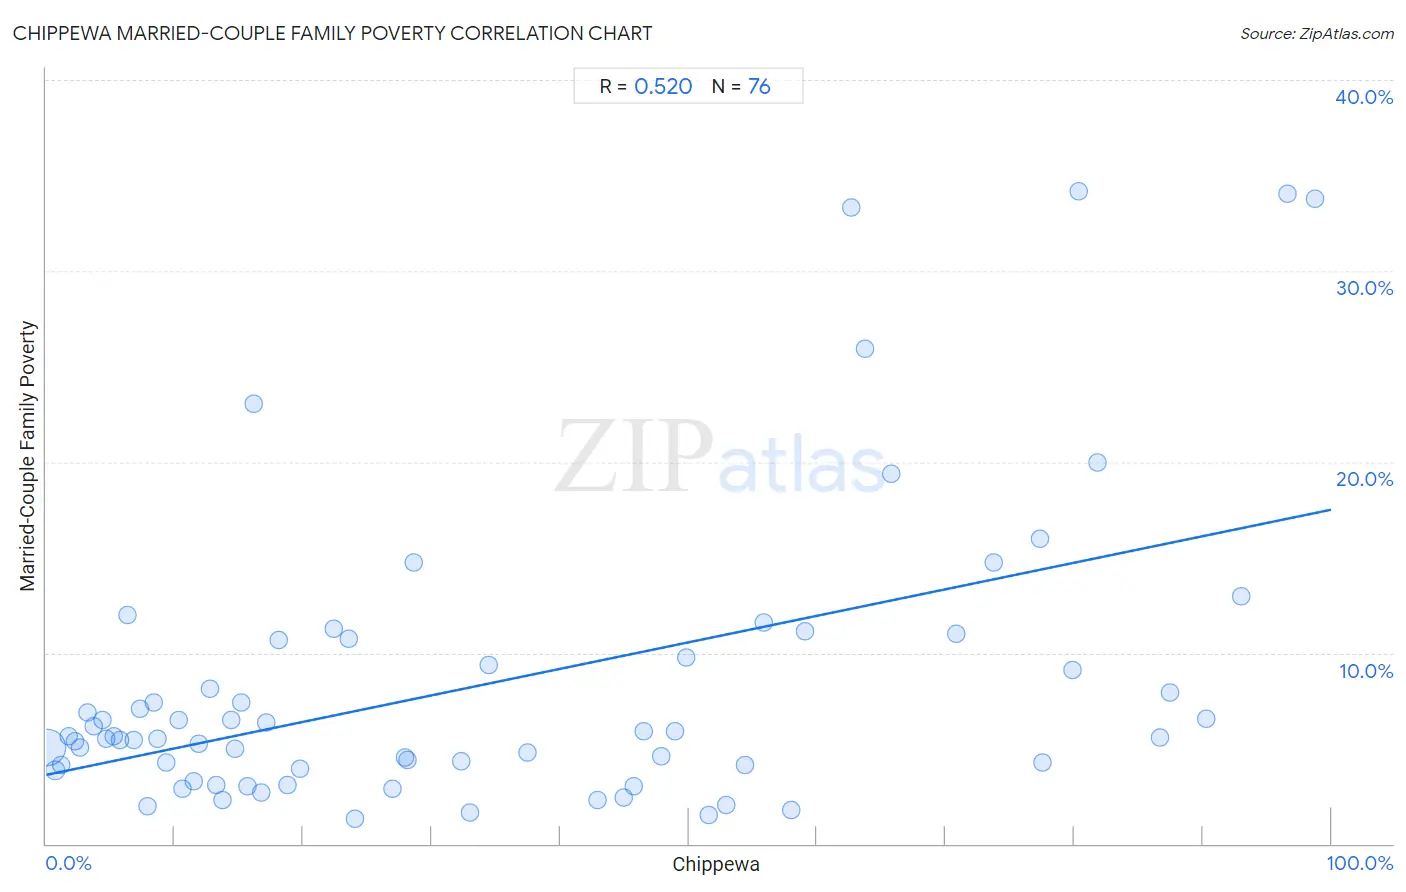
Chippewa Married-Couple Family Poverty Correlation Chart
The statistical analysis conducted on geographies consisting of 213,662,644 people shows a substantial positive correlation between the proportion of Chippewa and poverty level among married-couple families in the United States with a correlation coefficient (R) of 0.520 and weighted average of 5.4%. On average, for every 1% (one percent) increase in Chippewa within a typical geography, there is an increase of 0.14% in poverty level among married-couple families.
It is essential to understand that the correlation between the percentage of Chippewa and poverty level among married-couple families does not imply a direct cause-and-effect relationship. It remains uncertain whether the presence of Chippewa influences an upward or downward trend in the level of poverty level among married-couple families within an area, or if Chippewa simply ended up residing in those areas with higher or lower levels of poverty level among married-couple families due to other factors.
Demographics Similar to Chippewa by Married-Couple Family Poverty
In terms of married-couple family poverty, the demographic groups most similar to Chippewa are Immigrants from Costa Rica (5.4%, a difference of 0.080%), Osage (5.4%, a difference of 0.10%), Immigrants from Africa (5.5%, a difference of 0.24%), Immigrants from Peru (5.4%, a difference of 0.49%), and French American Indian (5.5%, a difference of 0.56%).
| Demographics | Rating | Rank | Married-Couple Family Poverty |
| Immigrants from Belarus | 26.2 /100 | #198 | Fair 5.4% |
| Uruguayans | 25.0 /100 | #199 | Fair 5.4% |
| Immigrants from Morocco | 24.3 /100 | #200 | Fair 5.4% |
| Lebanese | 24.1 /100 | #201 | Fair 5.4% |
| Immigrants from Middle Africa | 23.8 /100 | #202 | Fair 5.4% |
| Immigrants from Peru | 21.8 /100 | #203 | Fair 5.4% |
| Immigrants from Costa Rica | 19.4 /100 | #204 | Poor 5.4% |
| Chippewa | 18.9 /100 | #205 | Poor 5.4% |
| Osage | 18.4 /100 | #206 | Poor 5.4% |
| Immigrants from Africa | 17.6 /100 | #207 | Poor 5.5% |
| French American Indians | 16.1 /100 | #208 | Poor 5.5% |
| Immigrants from Syria | 15.4 /100 | #209 | Poor 5.5% |
| Immigrants from Micronesia | 14.4 /100 | #210 | Poor 5.5% |
| Nigerians | 14.3 /100 | #211 | Poor 5.5% |
| Immigrants from Thailand | 14.0 /100 | #212 | Poor 5.5% |
Chippewa Married-Couple Family Poverty Correlation Summary
| Measurement | Chippewa Data | Married-Couple Family Poverty Data |
| Minimum | 0.066% | 1.3% |
| Maximum | 98.7% | 34.1% |
| Range | 98.7% | 32.9% |
| Mean | 34.3% | 8.4% |
| Median | 23.8% | 5.6% |
| Interquartile 25% (IQ1) | 9.8% | 4.0% |
| Interquartile 75% (IQ3) | 55.1% | 10.2% |
| Interquartile Range (IQR) | 45.3% | 6.2% |
| Standard Deviation (Sample) | 29.1% | 7.8% |
| Standard Deviation (Population) | 28.9% | 7.7% |
Correlation Details
| Chippewa Percentile | Sample Size | Married-Couple Family Poverty |
[ 0.0% - 0.5% ] 0.066% | 203,876,893 | 5.0% |
[ 0.5% - 1.0% ] 0.70% | 6,058,862 | 3.8% |
[ 1.0% - 1.5% ] 1.16% | 1,830,105 | 4.2% |
[ 1.5% - 2.0% ] 1.72% | 483,971 | 5.6% |
[ 2.0% - 2.5% ] 2.21% | 394,294 | 5.4% |
[ 2.5% - 3.0% ] 2.65% | 337,207 | 5.0% |
[ 3.0% - 3.5% ] 3.25% | 118,494 | 6.9% |
[ 3.5% - 4.0% ] 3.72% | 86,253 | 6.2% |
[ 4.0% - 4.5% ] 4.35% | 80,307 | 6.5% |
[ 4.5% - 5.0% ] 4.65% | 40,838 | 5.5% |
[ 5.0% - 5.5% ] 5.21% | 19,727 | 5.6% |
[ 5.5% - 6.0% ] 5.74% | 15,029 | 5.4% |
[ 6.0% - 6.5% ] 6.31% | 3,139 | 12.0% |
[ 6.5% - 7.0% ] 6.79% | 8,724 | 5.5% |
[ 7.0% - 7.5% ] 7.34% | 14,372 | 7.1% |
[ 7.5% - 8.0% ] 7.86% | 21,201 | 1.9% |
[ 8.0% - 8.5% ] 8.39% | 5,065 | 7.4% |
[ 8.5% - 9.0% ] 8.64% | 3,438 | 5.5% |
[ 9.0% - 9.5% ] 9.35% | 40,419 | 4.2% |
[ 10.0% - 10.5% ] 10.27% | 15,061 | 6.5% |
[ 10.5% - 11.0% ] 10.65% | 37,597 | 2.9% |
[ 11.0% - 11.5% ] 11.45% | 17,994 | 3.3% |
[ 11.5% - 12.0% ] 11.83% | 1,640 | 5.2% |
[ 12.5% - 13.0% ] 12.70% | 7,320 | 8.1% |
[ 13.0% - 13.5% ] 13.19% | 7,188 | 3.1% |
[ 13.5% - 14.0% ] 13.68% | 2,448 | 2.3% |
[ 14.0% - 14.5% ] 14.35% | 1,115 | 6.5% |
[ 14.5% - 15.0% ] 14.65% | 16,808 | 5.0% |
[ 15.0% - 15.5% ] 15.20% | 2,480 | 7.4% |
[ 15.5% - 16.0% ] 15.64% | 21,121 | 3.0% |
[ 16.0% - 16.5% ] 16.13% | 31 | 23.1% |
[ 16.5% - 17.0% ] 16.76% | 16,587 | 2.7% |
[ 17.0% - 17.5% ] 17.11% | 2,390 | 6.4% |
[ 18.0% - 18.5% ] 18.09% | 4,482 | 10.7% |
[ 18.5% - 19.0% ] 18.73% | 3,433 | 3.1% |
[ 19.5% - 20.0% ] 19.72% | 3,798 | 3.9% |
[ 22.0% - 22.5% ] 22.35% | 434 | 11.3% |
[ 23.5% - 24.0% ] 23.56% | 3,290 | 10.7% |
[ 24.0% - 24.5% ] 24.03% | 795 | 1.3% |
[ 26.5% - 27.0% ] 26.93% | 3,628 | 2.9% |
[ 27.5% - 28.0% ] 27.92% | 4,499 | 4.5% |
[ 28.0% - 28.5% ] 28.12% | 2,233 | 4.4% |
[ 28.5% - 29.0% ] 28.57% | 119 | 14.7% |
[ 32.0% - 32.5% ] 32.26% | 248 | 4.3% |
[ 33.0% - 33.5% ] 33.02% | 957 | 1.6% |
[ 34.0% - 34.5% ] 34.48% | 406 | 9.4% |
[ 37.0% - 37.5% ] 37.44% | 6,234 | 4.8% |
[ 42.5% - 43.0% ] 42.90% | 1,275 | 2.3% |
[ 44.5% - 45.0% ] 44.99% | 2,863 | 2.4% |
[ 45.5% - 46.0% ] 45.68% | 1,819 | 3.0% |
[ 46.0% - 46.5% ] 46.49% | 114 | 5.9% |
[ 47.5% - 48.0% ] 47.84% | 648 | 4.6% |
[ 48.5% - 49.0% ] 48.91% | 5,021 | 5.9% |
[ 49.5% - 50.0% ] 49.83% | 299 | 9.8% |
[ 51.5% - 52.0% ] 51.53% | 1,011 | 1.5% |
[ 52.5% - 53.0% ] 52.88% | 2,969 | 2.0% |
[ 54.0% - 54.5% ] 54.37% | 607 | 4.1% |
[ 55.5% - 56.0% ] 55.80% | 776 | 11.6% |
[ 57.5% - 58.0% ] 57.97% | 395 | 1.8% |
[ 59.0% - 59.5% ] 59.07% | 237 | 11.1% |
[ 62.5% - 63.0% ] 62.62% | 1,228 | 33.3% |
[ 63.5% - 64.0% ] 63.75% | 1,854 | 25.9% |
[ 65.5% - 66.0% ] 65.71% | 525 | 19.4% |
[ 70.5% - 71.0% ] 70.82% | 2,940 | 11.0% |
[ 73.5% - 74.0% ] 73.74% | 613 | 14.7% |
[ 77.0% - 77.5% ] 77.29% | 1,026 | 16.0% |
[ 77.5% - 78.0% ] 77.55% | 1,755 | 4.3% |
[ 79.5% - 80.0% ] 79.88% | 323 | 9.1% |
[ 80.0% - 80.5% ] 80.39% | 459 | 34.1% |
[ 81.5% - 82.0% ] 81.78% | 472 | 20.0% |
[ 86.5% - 87.0% ] 86.67% | 285 | 5.6% |
[ 87.0% - 87.5% ] 87.42% | 1,772 | 7.9% |
[ 90.0% - 90.5% ] 90.28% | 792 | 6.5% |
[ 92.5% - 93.0% ] 92.99% | 5,920 | 12.9% |
[ 96.5% - 97.0% ] 96.58% | 789 | 34.0% |
[ 98.5% - 99.0% ] 98.73% | 1,183 | 33.8% |