Chippewa Self-Care Disability
COMPARE
Chippewa
Select to Compare
Self-Care Disability
Chippewa Self-Care Disability
2.6%
SELF-CARE DISABILITY
0.2/ 100
METRIC RATING
260th/ 347
METRIC RANK
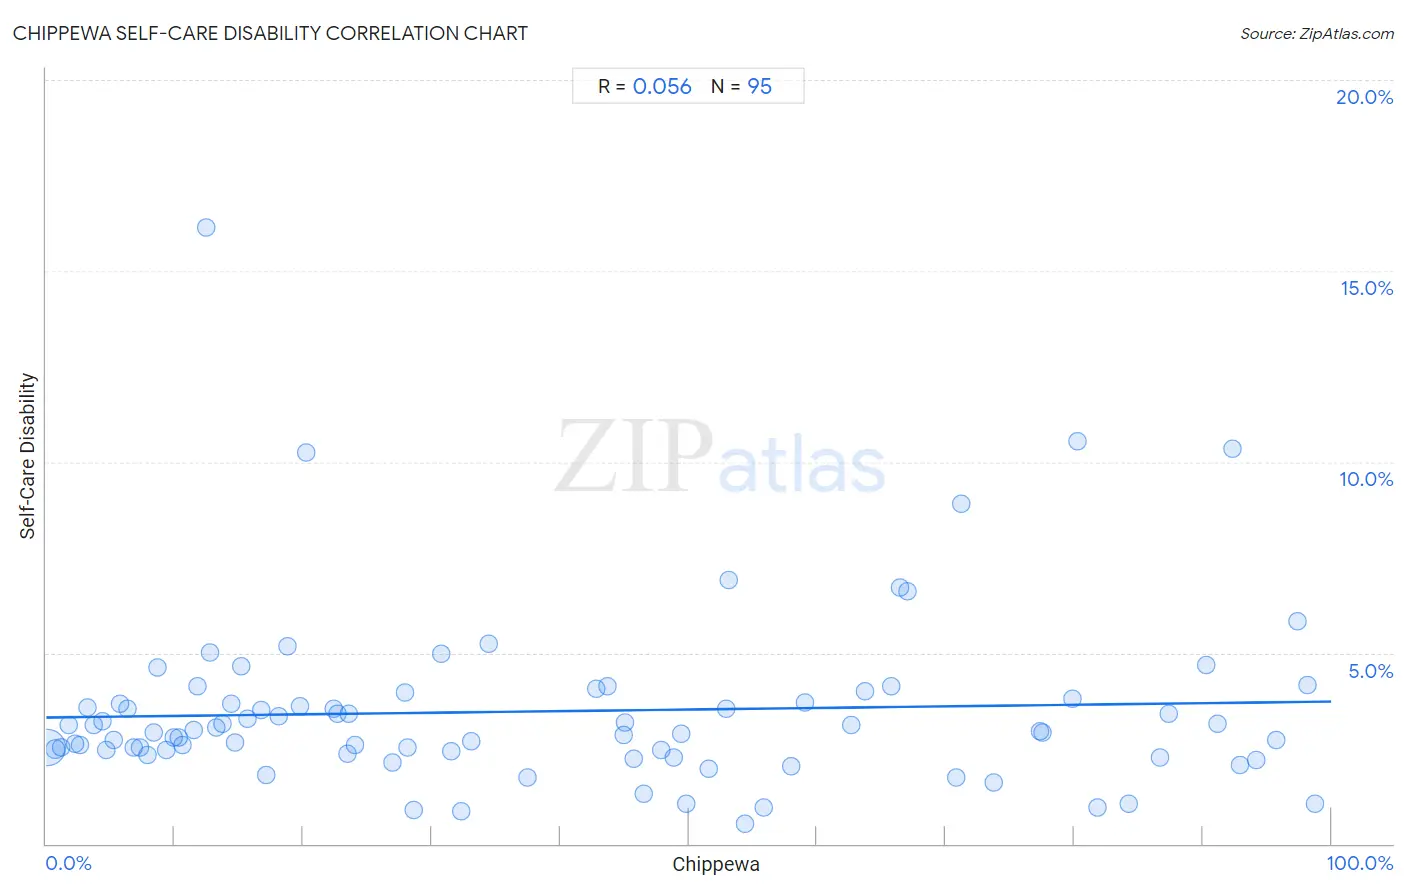
Chippewa Self-Care Disability Correlation Chart
The statistical analysis conducted on geographies consisting of 214,880,520 people shows a slight positive correlation between the proportion of Chippewa and percentage of population with self-care disability in the United States with a correlation coefficient (R) of 0.056 and weighted average of 2.6%. On average, for every 1% (one percent) increase in Chippewa within a typical geography, there is an increase of 0.0042% in percentage of population with self-care disability.
It is essential to understand that the correlation between the percentage of Chippewa and percentage of population with self-care disability does not imply a direct cause-and-effect relationship. It remains uncertain whether the presence of Chippewa influences an upward or downward trend in the level of percentage of population with self-care disability within an area, or if Chippewa simply ended up residing in those areas with higher or lower levels of percentage of population with self-care disability due to other factors.
Demographics Similar to Chippewa by Self-Care Disability
In terms of self-care disability, the demographic groups most similar to Chippewa are Arapaho (2.6%, a difference of 0.020%), Immigrants from Belarus (2.6%, a difference of 0.040%), Nonimmigrants (2.6%, a difference of 0.11%), Shoshone (2.7%, a difference of 0.16%), and Potawatomi (2.6%, a difference of 0.18%).
| Demographics | Rating | Rank | Self-Care Disability |
| Immigrants from Haiti | 0.3 /100 | #253 | Tragic 2.6% |
| Haitians | 0.3 /100 | #254 | Tragic 2.6% |
| Tsimshian | 0.3 /100 | #255 | Tragic 2.6% |
| Immigrants from Central America | 0.3 /100 | #256 | Tragic 2.6% |
| Potawatomi | 0.3 /100 | #257 | Tragic 2.6% |
| Nonimmigrants | 0.3 /100 | #258 | Tragic 2.6% |
| Immigrants from Belarus | 0.2 /100 | #259 | Tragic 2.6% |
| Chippewa | 0.2 /100 | #260 | Tragic 2.6% |
| Arapaho | 0.2 /100 | #261 | Tragic 2.6% |
| Shoshone | 0.2 /100 | #262 | Tragic 2.7% |
| Immigrants from Latin America | 0.2 /100 | #263 | Tragic 2.7% |
| Immigrants from Iran | 0.2 /100 | #264 | Tragic 2.7% |
| Immigrants from Nicaragua | 0.2 /100 | #265 | Tragic 2.7% |
| Immigrants from Cambodia | 0.1 /100 | #266 | Tragic 2.7% |
| Yaqui | 0.1 /100 | #267 | Tragic 2.7% |
Chippewa Self-Care Disability Correlation Summary
| Measurement | Chippewa Data | Self-Care Disability Data |
| Minimum | 0.066% | 0.52% |
| Maximum | 98.7% | 16.1% |
| Range | 98.7% | 15.6% |
| Mean | 38.8% | 3.5% |
| Median | 30.7% | 2.9% |
| Interquartile 25% (IQ1) | 11.8% | 2.4% |
| Interquartile 75% (IQ3) | 63.8% | 3.8% |
| Interquartile Range (IQR) | 52.0% | 1.4% |
| Standard Deviation (Sample) | 30.6% | 2.3% |
| Standard Deviation (Population) | 30.4% | 2.3% |
Correlation Details
| Chippewa Percentile | Sample Size | Self-Care Disability |
[ 0.0% - 0.5% ] 0.066% | 204,721,864 | 2.5% |
[ 0.5% - 1.0% ] 0.70% | 6,208,436 | 2.5% |
[ 1.0% - 1.5% ] 1.16% | 1,909,840 | 2.5% |
[ 1.5% - 2.0% ] 1.72% | 529,504 | 3.1% |
[ 2.0% - 2.5% ] 2.21% | 424,666 | 2.6% |
[ 2.5% - 3.0% ] 2.65% | 351,822 | 2.6% |
[ 3.0% - 3.5% ] 3.25% | 123,262 | 3.6% |
[ 3.5% - 4.0% ] 3.72% | 96,662 | 3.1% |
[ 4.0% - 4.5% ] 4.34% | 84,039 | 3.2% |
[ 4.5% - 5.0% ] 4.66% | 45,117 | 2.4% |
[ 5.0% - 5.5% ] 5.21% | 22,536 | 2.7% |
[ 5.5% - 6.0% ] 5.72% | 17,407 | 3.7% |
[ 6.0% - 6.5% ] 6.29% | 4,546 | 3.5% |
[ 6.5% - 7.0% ] 6.78% | 9,287 | 2.5% |
[ 7.0% - 7.5% ] 7.32% | 15,937 | 2.5% |
[ 7.5% - 8.0% ] 7.85% | 21,281 | 2.3% |
[ 8.0% - 8.5% ] 8.39% | 5,687 | 2.9% |
[ 8.5% - 9.0% ] 8.64% | 3,438 | 4.6% |
[ 9.0% - 9.5% ] 9.36% | 41,225 | 2.5% |
[ 9.5% - 10.0% ] 9.93% | 554 | 2.8% |
[ 10.0% - 10.5% ] 10.27% | 15,061 | 2.8% |
[ 10.5% - 11.0% ] 10.65% | 37,533 | 2.6% |
[ 11.0% - 11.5% ] 11.44% | 18,611 | 3.0% |
[ 11.5% - 12.0% ] 11.79% | 1,926 | 4.1% |
[ 12.0% - 12.5% ] 12.42% | 161 | 16.1% |
[ 12.5% - 13.0% ] 12.70% | 7,934 | 5.0% |
[ 13.0% - 13.5% ] 13.20% | 7,689 | 3.1% |
[ 13.5% - 14.0% ] 13.68% | 2,448 | 3.2% |
[ 14.0% - 14.5% ] 14.41% | 958 | 3.7% |
[ 14.5% - 15.0% ] 14.65% | 16,808 | 2.6% |
[ 15.0% - 15.5% ] 15.20% | 2,480 | 4.6% |
[ 15.5% - 16.0% ] 15.64% | 21,121 | 3.3% |
[ 16.5% - 17.0% ] 16.76% | 16,587 | 3.5% |
[ 17.0% - 17.5% ] 17.11% | 2,390 | 1.8% |
[ 18.0% - 18.5% ] 18.09% | 4,482 | 3.3% |
[ 18.5% - 19.0% ] 18.73% | 3,358 | 5.2% |
[ 19.5% - 20.0% ] 19.72% | 3,798 | 3.6% |
[ 20.0% - 20.5% ] 20.20% | 99 | 10.3% |
[ 22.0% - 22.5% ] 22.36% | 416 | 3.5% |
[ 22.5% - 23.0% ] 22.69% | 1,062 | 3.4% |
[ 23.0% - 23.5% ] 23.48% | 132 | 2.3% |
[ 23.5% - 24.0% ] 23.56% | 3,290 | 3.4% |
[ 24.0% - 24.5% ] 24.03% | 795 | 2.6% |
[ 26.5% - 27.0% ] 26.93% | 3,628 | 2.1% |
[ 27.5% - 28.0% ] 27.92% | 4,499 | 4.0% |
[ 28.0% - 28.5% ] 28.12% | 2,233 | 2.5% |
[ 28.5% - 29.0% ] 28.57% | 119 | 0.88% |
[ 30.5% - 31.0% ] 30.72% | 153 | 5.0% |
[ 31.5% - 32.0% ] 31.50% | 873 | 2.4% |
[ 32.0% - 32.5% ] 32.26% | 248 | 0.86% |
[ 33.0% - 33.5% ] 33.10% | 1,139 | 2.7% |
[ 34.0% - 34.5% ] 34.48% | 406 | 5.2% |
[ 37.0% - 37.5% ] 37.44% | 6,234 | 1.7% |
[ 42.5% - 43.0% ] 42.81% | 1,731 | 4.0% |
[ 43.5% - 44.0% ] 43.65% | 575 | 4.1% |
[ 44.5% - 45.0% ] 44.98% | 3,079 | 2.9% |
[ 45.0% - 45.5% ] 45.03% | 382 | 3.2% |
[ 45.5% - 46.0% ] 45.68% | 1,819 | 2.2% |
[ 46.0% - 46.5% ] 46.49% | 114 | 1.3% |
[ 47.5% - 48.0% ] 47.82% | 1,838 | 2.5% |
[ 48.5% - 49.0% ] 48.84% | 6,540 | 2.3% |
[ 49.0% - 49.5% ] 49.39% | 494 | 2.9% |
[ 49.5% - 50.0% ] 49.83% | 299 | 1.1% |
[ 51.5% - 52.0% ] 51.53% | 1,011 | 2.0% |
[ 52.5% - 53.0% ] 52.88% | 2,969 | 3.6% |
[ 53.0% - 53.5% ] 53.12% | 32 | 6.9% |
[ 54.0% - 54.5% ] 54.37% | 607 | 0.52% |
[ 55.5% - 56.0% ] 55.80% | 776 | 0.97% |
[ 57.5% - 58.0% ] 57.97% | 395 | 2.0% |
[ 59.0% - 59.5% ] 59.07% | 237 | 3.7% |
[ 62.5% - 63.0% ] 62.67% | 1,733 | 3.1% |
[ 63.5% - 64.0% ] 63.75% | 1,854 | 4.0% |
[ 65.5% - 66.0% ] 65.79% | 839 | 4.1% |
[ 66.0% - 66.5% ] 66.47% | 683 | 6.7% |
[ 66.5% - 67.0% ] 66.98% | 733 | 6.6% |
[ 70.5% - 71.0% ] 70.82% | 2,940 | 1.7% |
[ 71.0% - 71.5% ] 71.23% | 146 | 8.9% |
[ 73.5% - 74.0% ] 73.74% | 613 | 1.6% |
[ 77.0% - 77.5% ] 77.29% | 1,026 | 2.9% |
[ 77.5% - 78.0% ] 77.56% | 2,117 | 2.9% |
[ 79.5% - 80.0% ] 79.88% | 323 | 3.8% |
[ 80.0% - 80.5% ] 80.22% | 91 | 10.5% |
[ 81.5% - 82.0% ] 81.78% | 472 | 0.95% |
[ 84.0% - 84.5% ] 84.28% | 318 | 1.0% |
[ 86.5% - 87.0% ] 86.67% | 285 | 2.2% |
[ 87.0% - 87.5% ] 87.40% | 2,071 | 3.4% |
[ 90.0% - 90.5% ] 90.28% | 792 | 4.7% |
[ 91.0% - 91.5% ] 91.13% | 203 | 3.1% |
[ 92.0% - 92.5% ] 92.31% | 39 | 10.3% |
[ 92.5% - 93.0% ] 92.90% | 7,355 | 2.1% |
[ 94.0% - 94.5% ] 94.16% | 2,960 | 2.2% |
[ 95.5% - 96.0% ] 95.75% | 1,011 | 2.7% |
[ 97.0% - 97.5% ] 97.42% | 852 | 5.8% |
[ 98.0% - 98.5% ] 98.17% | 1,202 | 4.2% |
[ 98.5% - 99.0% ] 98.73% | 1,183 | 1.0% |