Cheyenne Married-couple Households
COMPARE
Cheyenne
Select to Compare
Married-couple Households
Cheyenne Married-couple Households
42.3%
MARRIED-COUPLE HOUSEHOLDS
0.0/ 100
METRIC RATING
284th/ 347
METRIC RANK
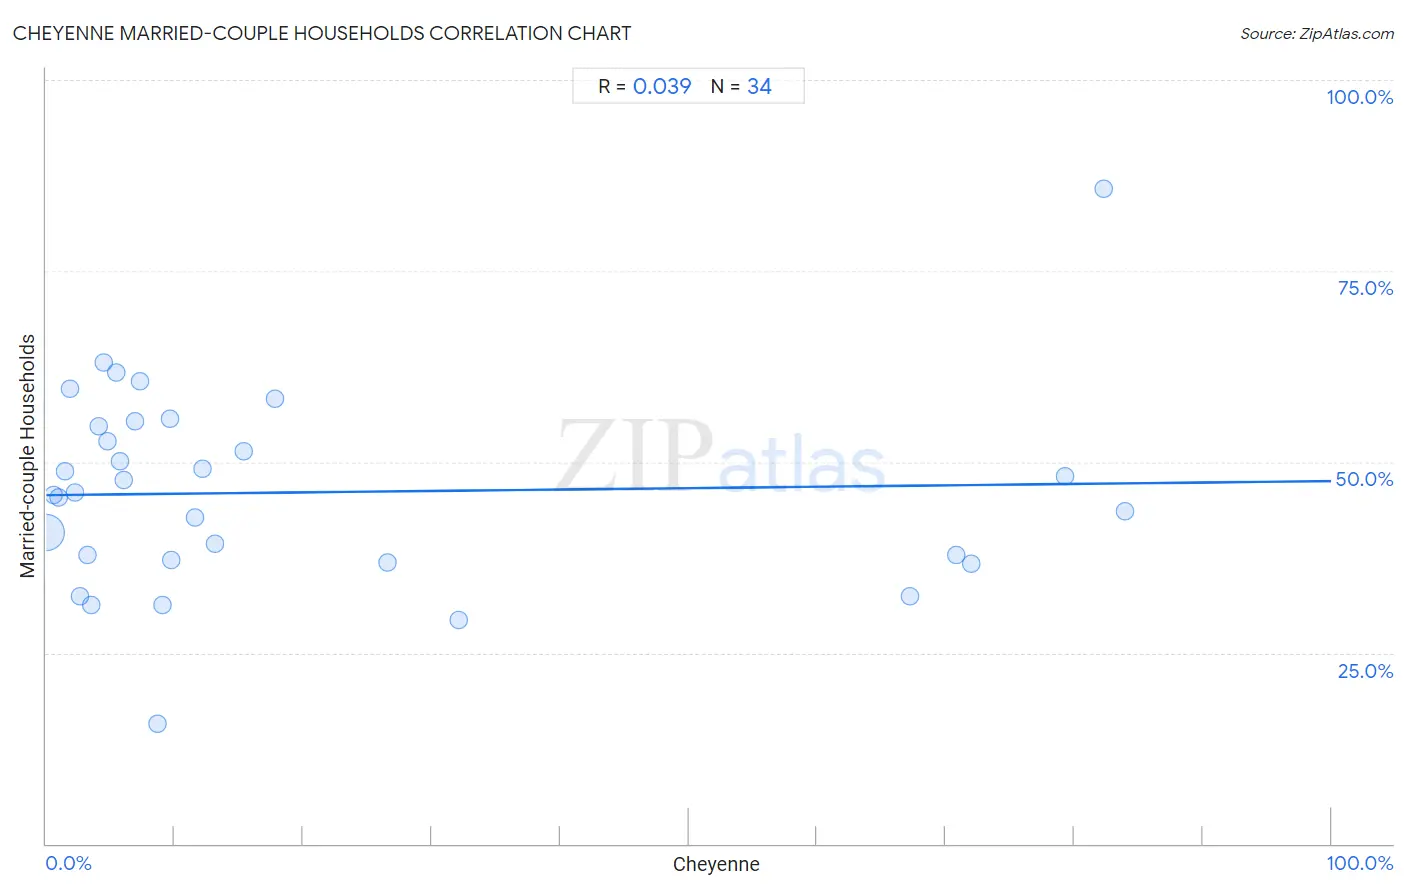
Cheyenne Married-couple Households Correlation Chart
The statistical analysis conducted on geographies consisting of 80,704,994 people shows no correlation between the proportion of Cheyenne and percentage of married-couple family households in the United States with a correlation coefficient (R) of 0.039 and weighted average of 42.3%. On average, for every 1% (one percent) increase in Cheyenne within a typical geography, there is an increase of 0.018% in percentage of married-couple family households.
It is essential to understand that the correlation between the percentage of Cheyenne and percentage of married-couple family households does not imply a direct cause-and-effect relationship. It remains uncertain whether the presence of Cheyenne influences an upward or downward trend in the level of percentage of married-couple family households within an area, or if Cheyenne simply ended up residing in those areas with higher or lower levels of percentage of married-couple family households due to other factors.
Demographics Similar to Cheyenne by Married-couple Households
In terms of married-couple households, the demographic groups most similar to Cheyenne are Ghanaian (42.2%, a difference of 0.030%), Belizean (42.2%, a difference of 0.040%), Chippewa (42.1%, a difference of 0.27%), Immigrants from Eritrea (42.1%, a difference of 0.35%), and Inupiat (42.4%, a difference of 0.36%).
| Demographics | Rating | Rank | Married-couple Households |
| Immigrants from Eastern Africa | 0.0 /100 | #277 | Tragic 42.9% |
| Immigrants from Africa | 0.0 /100 | #278 | Tragic 42.9% |
| Sierra Leoneans | 0.0 /100 | #279 | Tragic 42.9% |
| Immigrants from Ecuador | 0.0 /100 | #280 | Tragic 42.9% |
| Immigrants from Guatemala | 0.0 /100 | #281 | Tragic 42.8% |
| Bermudans | 0.0 /100 | #282 | Tragic 42.4% |
| Inupiat | 0.0 /100 | #283 | Tragic 42.4% |
| Cheyenne | 0.0 /100 | #284 | Tragic 42.3% |
| Ghanaians | 0.0 /100 | #285 | Tragic 42.2% |
| Belizeans | 0.0 /100 | #286 | Tragic 42.2% |
| Chippewa | 0.0 /100 | #287 | Tragic 42.1% |
| Immigrants from Eritrea | 0.0 /100 | #288 | Tragic 42.1% |
| Sudanese | 0.0 /100 | #289 | Tragic 42.1% |
| Hondurans | 0.0 /100 | #290 | Tragic 42.1% |
| Paiute | 0.0 /100 | #291 | Tragic 42.1% |
Cheyenne Married-couple Households Correlation Summary
| Measurement | Cheyenne Data | Married-couple Households Data |
| Minimum | 0.026% | 15.8% |
| Maximum | 84.0% | 85.7% |
| Range | 83.9% | 69.9% |
| Mean | 20.1% | 46.0% |
| Median | 8.0% | 45.8% |
| Interquartile 25% (IQ1) | 3.5% | 37.1% |
| Interquartile 75% (IQ3) | 17.8% | 54.6% |
| Interquartile Range (IQR) | 14.3% | 17.5% |
| Standard Deviation (Sample) | 27.3% | 12.9% |
| Standard Deviation (Population) | 26.8% | 12.7% |
Correlation Details
| Cheyenne Percentile | Sample Size | Married-couple Households |
[ 0.0% - 0.5% ] 0.026% | 79,645,177 | 40.8% |
[ 0.5% - 1.0% ] 0.58% | 518,072 | 45.6% |
[ 1.0% - 1.5% ] 1.00% | 369,167 | 45.4% |
[ 1.0% - 1.5% ] 1.44% | 50,624 | 48.8% |
[ 1.5% - 2.0% ] 1.87% | 43,194 | 59.5% |
[ 2.0% - 2.5% ] 2.27% | 15,566 | 46.0% |
[ 2.5% - 3.0% ] 2.64% | 6,297 | 32.4% |
[ 3.0% - 3.5% ] 3.18% | 10,264 | 37.7% |
[ 3.5% - 4.0% ] 3.51% | 7,493 | 31.3% |
[ 4.0% - 4.5% ] 4.09% | 8,702 | 54.6% |
[ 4.0% - 4.5% ] 4.44% | 2,409 | 63.0% |
[ 4.5% - 5.0% ] 4.73% | 3,593 | 52.8% |
[ 5.0% - 5.5% ] 5.45% | 220 | 61.7% |
[ 5.5% - 6.0% ] 5.70% | 2,651 | 50.1% |
[ 6.0% - 6.5% ] 6.06% | 297 | 47.7% |
[ 6.5% - 7.0% ] 6.92% | 1,603 | 55.3% |
[ 7.0% - 7.5% ] 7.26% | 1,680 | 60.6% |
[ 8.5% - 9.0% ] 8.70% | 92 | 15.8% |
[ 9.0% - 9.5% ] 9.00% | 100 | 31.2% |
[ 9.5% - 10.0% ] 9.58% | 4,654 | 55.6% |
[ 9.5% - 10.0% ] 9.72% | 1,132 | 37.1% |
[ 11.5% - 12.0% ] 11.56% | 173 | 42.7% |
[ 12.0% - 12.5% ] 12.12% | 1,692 | 49.1% |
[ 13.0% - 13.5% ] 13.18% | 387 | 39.3% |
[ 15.0% - 15.5% ] 15.35% | 391 | 51.4% |
[ 17.5% - 18.0% ] 17.83% | 129 | 58.3% |
[ 26.5% - 27.0% ] 26.58% | 1,125 | 36.9% |
[ 32.0% - 32.5% ] 32.06% | 783 | 29.3% |
[ 67.0% - 67.5% ] 67.20% | 2,064 | 32.4% |
[ 70.5% - 71.0% ] 70.81% | 966 | 37.8% |
[ 71.5% - 72.0% ] 71.99% | 3,038 | 36.6% |
[ 79.0% - 79.5% ] 79.32% | 474 | 48.1% |
[ 82.0% - 82.5% ] 82.26% | 124 | 85.7% |
[ 83.5% - 84.0% ] 83.96% | 661 | 43.5% |