Cheyenne 1 or more Vehicles in Household

COMPARE

Cheyenne
Race
Ancestry
AfghanAfricanAlaska NativeAlaskan AthabascanAlbanianAleutAlsatianAmericanApacheArabArapahoArgentineanArmenianAssyrian/Chaldean/SyriacAustralianAustrianBahamianBangladeshiBarbadianBasqueBelgianBelizeanBermudanBhutaneseBlackfeetBolivianBrazilianBritishBritish West IndianBulgarianBurmeseCajunCambodianCanadianCape VerdeanCarpatho RusynCelticCentral AmericanCentral American IndianCherokeeCheyenneChickasawChileanChineseChippewaChoctawColombianColvilleComancheCosta RicanCreeCreekCroatianCrowCubanCypriotCzechCzechoslovakianDanishDelawareDominicanDutchDutch West IndianEastern EuropeanEcuadorianEgyptianEnglishEstonianEthiopianEuropeanFijianFilipinoFinnishFrenchFrench American IndianFrench CanadianGermanGerman RussianGhanaianGreekGuamanian/ChamorroGuatemalanGuyaneseHaitianHmongHonduranHopiHoumaHungarianIcelanderIndian (Asian)IndonesianInupiatIranianIraqiIrishIroquoisIsraeliItalianJamaicanJapaneseJordanianKenyanKiowaKoreanLaotianLatvianLebaneseLiberianLithuanianLumbeeLuxembourgerMacedonianMalaysianMalteseMarshalleseMenomineeMexicanMexican American IndianMongolianMoroccanNative HawaiianNavajoNepaleseNew ZealanderNicaraguanNigerianNorthern EuropeanNorwegianOkinawanOsageOttawaPaiutePakistaniPalestinianPanamanianParaguayanPennsylvania GermanPeruvianPimaPolishPortuguesePotawatomiPuebloPuerto RicanPuget Sound SalishRomanianRussianSalvadoranSamoanScandinavianScotch-IrishScottishSeminoleSenegaleseSerbianShoshoneSierra LeoneanSiouxSlavicSlovakSloveneSomaliSouth AfricanSouth AmericanSouth American IndianSoviet UnionSpaniardSpanishSpanish AmericanSpanish American IndianSri LankanSubsaharan AfricanSudaneseSwedishSwissSyrianTaiwaneseThaiTlingit-HaidaTohono O'OdhamTonganTrinidadian and TobagonianTsimshianTurkishU.S. Virgin IslanderUgandanUkrainianUruguayanUteVenezuelanVietnameseWelshWest IndianYakamaYaquiYugoslavianYumanYup'ikZimbabwean
Immigration
NonimmigrantsImmigrantsAfghanistanAfricaAlbaniaArgentinaArmeniaAsiaAustraliaAustriaBahamasBangladeshBarbadosBelarusBelgiumBelizeBoliviaBosnia and HerzegovinaBrazilBulgariaBurma/MyanmarCabo VerdeCambodiaCameroonCanadaCaribbeanCentral AmericaChileChinaColombiaCongoCosta RicaCroatiaCubaCzechoslovakiaDenmarkDominicaDominican RepublicEastern AfricaEastern AsiaEastern EuropeEcuadorEgyptEl SalvadorEnglandEritreaEthiopiaEuropeFijiFranceGermanyGhanaGreeceGrenadaGuatemalaGuyanaHaitiHondurasHong KongHungaryIndiaIndonesiaIranIraqIrelandIsraelItalyJamaicaJapanJordanKazakhstanKenyaKoreaKuwaitLaosLatin AmericaLatviaLebanonLiberiaLithuaniaMalaysiaMexicoMicronesiaMiddle AfricaMoldovaMoroccoNepalNetherlandsNicaraguaNigeriaNorth AmericaNorth MacedoniaNorthern AfricaNorthern EuropeNorwayOceaniaPakistanPanamaPeruPhilippinesPolandPortugalRomaniaRussiaSaudi ArabiaScotlandSenegalSerbiaSierra LeoneSingaporeSomaliaSouth AfricaSouth AmericaSouth Central AsiaSouth Eastern AsiaSouthern EuropeSpainSri LankaSt. Vincent and the GrenadinesSudanSwedenSwitzerlandSyriaTaiwanThailandTrinidad and TobagoTurkeyUgandaUkraineUruguayUzbekistanVenezuelaVietnamWest IndiesWestern AfricaWestern AsiaWestern EuropeYemenZaireZimbabweAzores
Select to Compare
Race
Ancestry
AfghanAfricanAlaska NativeAlaskan AthabascanAlbanianAleutAlsatianAmericanApacheArabArapahoArgentineanArmenianAssyrian/Chaldean/SyriacAustralianAustrianBahamianBangladeshiBarbadianBasqueBelgianBelizeanBermudanBhutaneseBlackfeetBolivianBrazilianBritishBritish West IndianBulgarianBurmeseCajunCambodianCanadianCape VerdeanCarpatho RusynCelticCentral AmericanCentral American IndianCherokeeChickasawChileanChineseChippewaChoctawColombianColvilleComancheCosta RicanCreeCreekCroatianCrowCubanCypriotCzechCzechoslovakianDanishDelawareDominicanDutchDutch West IndianEastern EuropeanEcuadorianEgyptianEnglishEstonianEthiopianEuropeanFijianFilipinoFinnishFrenchFrench American IndianFrench CanadianGermanGerman RussianGhanaianGreekGuamanian/ChamorroGuatemalanGuyaneseHaitianHmongHonduranHopiHoumaHungarianIcelanderIndian (Asian)IndonesianInupiatIranianIraqiIrishIroquoisIsraeliItalianJamaicanJapaneseJordanianKenyanKiowaKoreanLaotianLatvianLebaneseLiberianLithuanianLumbeeLuxembourgerMacedonianMalaysianMalteseMarshalleseMenomineeMexicanMexican American IndianMongolianMoroccanNative HawaiianNavajoNepaleseNew ZealanderNicaraguanNigerianNorthern EuropeanNorwegianOkinawanOsageOttawaPaiutePakistaniPalestinianPanamanianParaguayanPennsylvania GermanPeruvianPimaPolishPortuguesePotawatomiPuebloPuerto RicanPuget Sound SalishRomanianRussianSalvadoranSamoanScandinavianScotch-IrishScottishSeminoleSenegaleseSerbianShoshoneSierra LeoneanSiouxSlavicSlovakSloveneSomaliSouth AfricanSouth AmericanSouth American IndianSoviet UnionSpaniardSpanishSpanish AmericanSpanish American IndianSri LankanSubsaharan AfricanSudaneseSwedishSwissSyrianTaiwaneseThaiTlingit-HaidaTohono O'OdhamTonganTrinidadian and TobagonianTsimshianTurkishU.S. Virgin IslanderUgandanUkrainianUruguayanUteVenezuelanVietnameseWelshWest IndianYakamaYaquiYugoslavianYumanYup'ikZimbabwean
Immigration
NonimmigrantsImmigrantsAfghanistanAfricaAlbaniaArgentinaArmeniaAsiaAustraliaAustriaBahamasBangladeshBarbadosBelarusBelgiumBelizeBoliviaBosnia and HerzegovinaBrazilBulgariaBurma/MyanmarCabo VerdeCambodiaCameroonCanadaCaribbeanCentral AmericaChileChinaColombiaCongoCosta RicaCroatiaCubaCzechoslovakiaDenmarkDominicaDominican RepublicEastern AfricaEastern AsiaEastern EuropeEcuadorEgyptEl SalvadorEnglandEritreaEthiopiaEuropeFijiFranceGermanyGhanaGreeceGrenadaGuatemalaGuyanaHaitiHondurasHong KongHungaryIndiaIndonesiaIranIraqIrelandIsraelItalyJamaicaJapanJordanKazakhstanKenyaKoreaKuwaitLaosLatin AmericaLatviaLebanonLiberiaLithuaniaMalaysiaMexicoMicronesiaMiddle AfricaMoldovaMoroccoNepalNetherlandsNicaraguaNigeriaNorth AmericaNorth MacedoniaNorthern AfricaNorthern EuropeNorwayOceaniaPakistanPanamaPeruPhilippinesPolandPortugalRomaniaRussiaSaudi ArabiaScotlandSenegalSerbiaSierra LeoneSingaporeSomaliaSouth AfricaSouth AmericaSouth Central AsiaSouth Eastern AsiaSouthern EuropeSpainSri LankaSt. Vincent and the GrenadinesSudanSwedenSwitzerlandSyriaTaiwanThailandTrinidad and TobagoTurkeyUgandaUkraineUruguayUzbekistanVenezuelaVietnamWest IndiesWestern AfricaWestern AsiaWestern EuropeYemenZaireZimbabweAzores
1 or more Vehicles in Household
Income
Poverty
Unemployment
Labor Participation
Family Structure
Vehicle Availability
Education Level
Disability

Cheyenne 1 or more Vehicles in Household
Tragic

88.7%
1+ VEHICLES AVAILABLE
5.7/ 100
METRIC RATING
226th/ 347
METRIC RANK

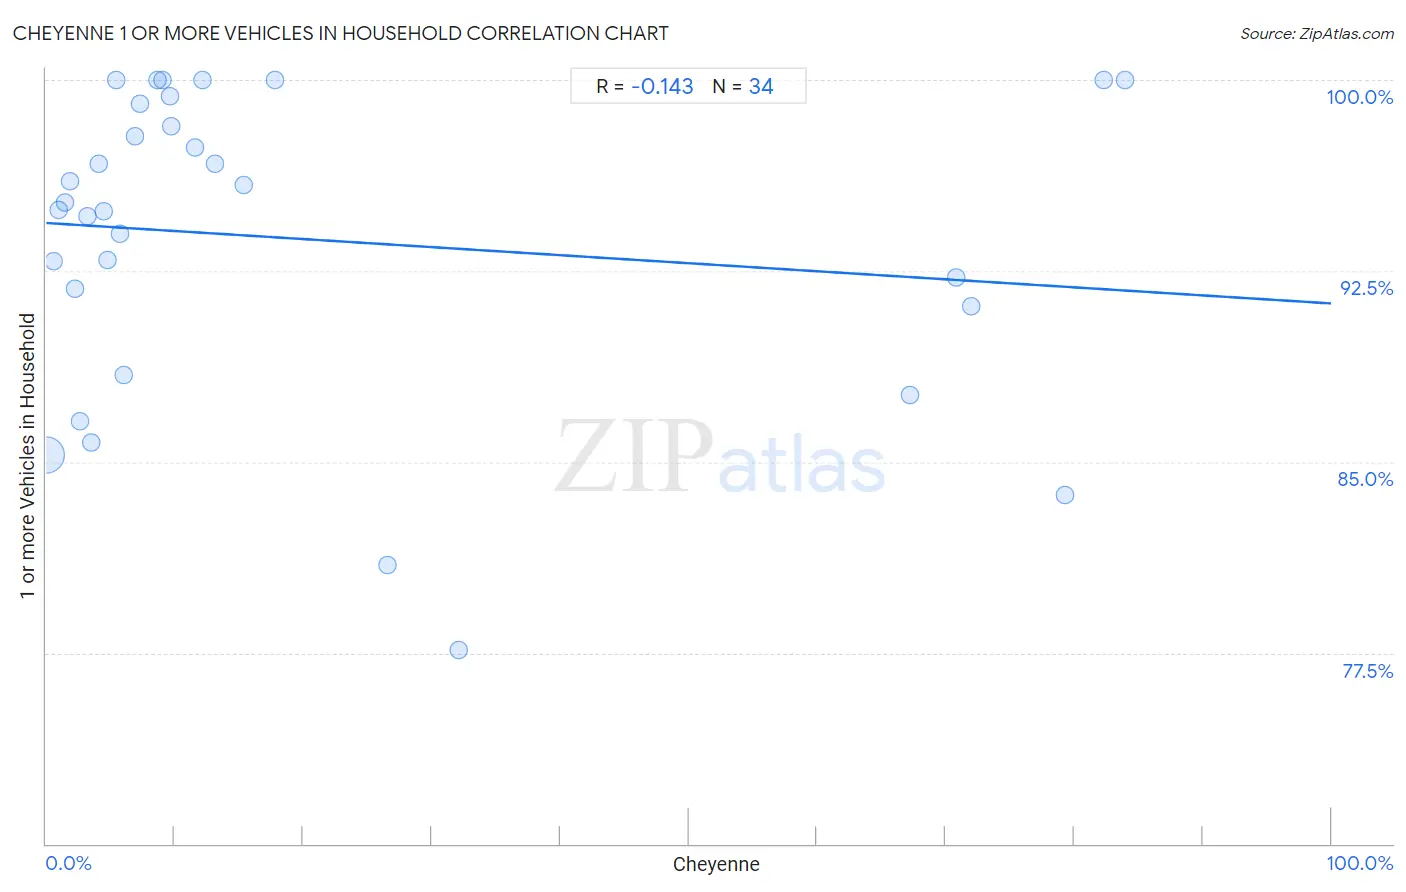
Cheyenne 1 or more Vehicles in Household Correlation Chart

The statistical analysis conducted on geographies consisting of 80,710,429 people shows a poor negative correlation between the proportion of Cheyenne and percentage of households with 1 or more vehicles available in the United States with a correlation coefficient (R) of -0.143 and weighted average of 88.7%. On average, for every 1% (one percent) increase in Cheyenne within a typical geography, there is a decrease of 0.032% in percentage of households with 1 or more vehicles available.
Cheyenne 1 or more Vehicles in Household
It is essential to understand that the correlation between the percentage of Cheyenne and percentage of households with 1 or more vehicles available does not imply a direct cause-and-effect relationship. It remains uncertain whether the presence of Cheyenne influences an upward or downward trend in the level of percentage of households with 1 or more vehicles available within an area, or if Cheyenne simply ended up residing in those areas with higher or lower levels of percentage of households with 1 or more vehicles available due to other factors.

Demographics Similar to Cheyenne by 1 or more Vehicles in Household

In terms of 1 or more vehicles in household, the demographic groups most similar to Cheyenne are Ute (88.7%, a difference of 0.0%), Immigrants from Norway (88.7%, a difference of 0.010%), Immigrants from Romania (88.7%, a difference of 0.020%), Cree (88.7%, a difference of 0.030%), and Immigrants from Hong Kong (88.7%, a difference of 0.040%).
DemographicsRating | Rank1 or more Vehicles in Household
Immigrants from Guatemala
8.6
/100
|
#219
Tragic
88.9%
Immigrants from Zaire
8.1
/100
|
#220
Tragic
88.8%
Peruvians
7.9
/100
|
#221
Tragic
88.8%
Uruguayans
7.0
/100
|
#222
Tragic
88.8%
Immigrants from South America
7.0
/100
|
#223
Tragic
88.8%
Immigrants from Hong Kong
6.2
/100
|
#224
Tragic
88.7%
Cree
6.0
/100
|
#225
Tragic
88.7%
Cheyenne
5.7
/100
|
#226
Tragic
88.7%
Ute
5.6
/100
|
#227
Tragic
88.7%
Immigrants from Norway
5.5
/100
|
#228
Tragic
88.7%
Immigrants from Romania
5.4
/100
|
#229
Tragic
88.7%
Immigrants from Sierra Leone
5.2
/100
|
#230
Tragic
88.7%
Russians
5.0
/100
|
#231
Tragic
88.7%
Immigrants from Japan
4.9
/100
|
#232
Tragic
88.7%
Houma
4.8
/100
|
#233
Tragic
88.6%

Cheyenne 1 or more Vehicles in Household Correlation Summary

MeasurementCheyenne Data1 or more Vehicles in Household Data
Minimum0.026%77.6%
Maximum84.0%100.0%
Range83.9%22.4%
Mean20.1%93.8%
Median8.0%95.1%
Interquartile 25% (IQ1)3.5%91.1%
Interquartile 75% (IQ3)17.8%99.1%
Interquartile Range (IQR)14.3%7.9%
Standard Deviation (Sample)27.3%6.0%
Standard Deviation (Population)26.8%6.0%

Correlation Details

Cheyenne PercentileSample Size1 or more Vehicles in Household
[
0.0%
-
0.5%
]
0.026%
79,650,41085.2%
[
0.5%
-
1.0%
]
0.58%
518,07292.9%
[
1.0%
-
1.5%
]
1.00%
369,16794.9%
[
1.0%
-
1.5%
]
1.44%
50,62495.2%
[
1.5%
-
2.0%
]
1.87%
43,19496.0%
[
2.0%
-
2.5%
]
2.27%
15,56691.8%
[
2.5%
-
3.0%
]
2.64%
6,29786.6%
[
3.0%
-
3.5%
]
3.18%
10,26494.7%
[
3.5%
-
4.0%
]
3.51%
7,49385.7%
[
4.0%
-
4.5%
]
4.09%
8,70296.7%
[
4.0%
-
4.5%
]
4.44%
2,61194.9%
[
4.5%
-
5.0%
]
4.73%
3,59392.9%
[
5.0%
-
5.5%
]
5.45%
220100.0%
[
5.5%
-
6.0%
]
5.70%
2,65194.0%
[
6.0%
-
6.5%
]
6.06%
29788.4%
[
6.5%
-
7.0%
]
6.92%
1,60397.8%
[
7.0%
-
7.5%
]
7.26%
1,68099.1%
[
8.5%
-
9.0%
]
8.70%
92100.0%
[
9.0%
-
9.5%
]
9.00%
100100.0%
[
9.5%
-
10.0%
]
9.58%
4,65499.4%
[
9.5%
-
10.0%
]
9.72%
1,13298.2%
[
11.5%
-
12.0%
]
11.56%
17397.3%
[
12.0%
-
12.5%
]
12.12%
1,692100.0%
[
13.0%
-
13.5%
]
13.18%
38796.7%
[
15.0%
-
15.5%
]
15.35%
39195.9%
[
17.5%
-
18.0%
]
17.83%
129100.0%
[
26.5%
-
27.0%
]
26.58%
1,12581.0%
[
32.0%
-
32.5%
]
32.06%
78377.6%
[
67.0%
-
67.5%
]
67.20%
2,06487.6%
[
70.5%
-
71.0%
]
70.81%
96692.2%
[
71.5%
-
72.0%
]
71.99%
3,03891.1%
[
79.0%
-
79.5%
]
79.32%
47483.7%
[
82.0%
-
82.5%
]
82.26%
124100.0%
[
83.5%
-
84.0%
]
83.96%
661100.0%