Cheyenne Self-Care Disability
COMPARE
Cheyenne
Select to Compare
Self-Care Disability
Cheyenne Self-Care Disability
2.6%
SELF-CARE DISABILITY
0.6/ 100
METRIC RATING
246th/ 347
METRIC RANK
Cheyenne Self-Care Disability Correlation Chart
The statistical analysis conducted on geographies consisting of 80,691,383 people shows a weak negative correlation between the proportion of Cheyenne and percentage of population with self-care disability in the United States with a correlation coefficient (R) of -0.203 and weighted average of 2.6%. On average, for every 1% (one percent) increase in Cheyenne within a typical geography, there is a decrease of 0.024% in percentage of population with self-care disability.
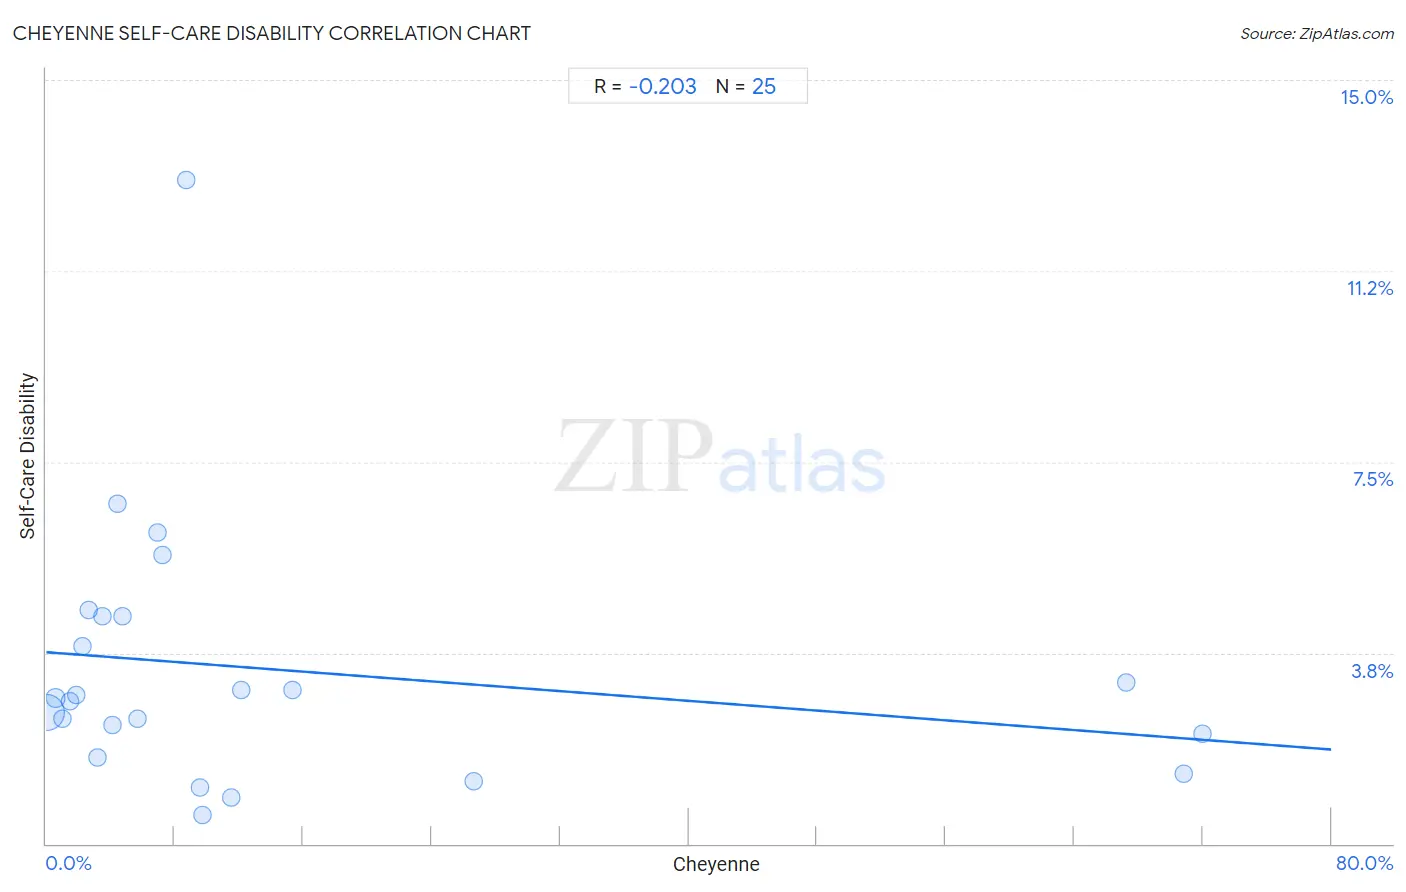
It is essential to understand that the correlation between the percentage of Cheyenne and percentage of population with self-care disability does not imply a direct cause-and-effect relationship. It remains uncertain whether the presence of Cheyenne influences an upward or downward trend in the level of percentage of population with self-care disability within an area, or if Cheyenne simply ended up residing in those areas with higher or lower levels of percentage of population with self-care disability due to other factors.
Demographics Similar to Cheyenne by Self-Care Disability
In terms of self-care disability, the demographic groups most similar to Cheyenne are Immigrants from Western Asia (2.6%, a difference of 0.020%), Immigrants from Albania (2.6%, a difference of 0.13%), Nicaraguan (2.6%, a difference of 0.13%), Yuman (2.6%, a difference of 0.21%), and Hawaiian (2.6%, a difference of 0.25%).
| Demographics | Rating | Rank | Self-Care Disability |
| Immigrants from Panama | 1.2 /100 | #239 | Tragic 2.6% |
| Marshallese | 1.2 /100 | #240 | Tragic 2.6% |
| Immigrants from Syria | 1.0 /100 | #241 | Tragic 2.6% |
| Spanish | 0.8 /100 | #242 | Tragic 2.6% |
| Hawaiians | 0.8 /100 | #243 | Tragic 2.6% |
| Yuman | 0.8 /100 | #244 | Tragic 2.6% |
| Immigrants from Western Asia | 0.6 /100 | #245 | Tragic 2.6% |
| Cheyenne | 0.6 /100 | #246 | Tragic 2.6% |
| Immigrants from Albania | 0.6 /100 | #247 | Tragic 2.6% |
| Nicaraguans | 0.6 /100 | #248 | Tragic 2.6% |
| Mexican American Indians | 0.5 /100 | #249 | Tragic 2.6% |
| Portuguese | 0.4 /100 | #250 | Tragic 2.6% |
| Immigrants from Liberia | 0.4 /100 | #251 | Tragic 2.6% |
| Immigrants from Bangladesh | 0.4 /100 | #252 | Tragic 2.6% |
| Immigrants from Haiti | 0.3 /100 | #253 | Tragic 2.6% |
Cheyenne Self-Care Disability Correlation Summary
| Measurement | Cheyenne Data | Self-Care Disability Data |
| Minimum | 0.026% | 0.57% |
| Maximum | 72.0% | 13.0% |
| Range | 72.0% | 12.5% |
| Mean | 14.1% | 3.4% |
| Median | 5.7% | 2.9% |
| Interquartile 25% (IQ1) | 2.5% | 1.9% |
| Interquartile 75% (IQ3) | 11.8% | 4.5% |
| Interquartile Range (IQR) | 9.4% | 2.5% |
| Standard Deviation (Sample) | 21.8% | 2.6% |
| Standard Deviation (Population) | 21.4% | 2.5% |
Correlation Details
| Cheyenne Percentile | Sample Size | Self-Care Disability |
[ 0.0% - 0.5% ] 0.026% | 79,645,812 | 2.6% |
[ 0.5% - 1.0% ] 0.58% | 516,170 | 2.9% |
[ 1.0% - 1.5% ] 1.00% | 362,183 | 2.5% |
[ 1.0% - 1.5% ] 1.44% | 49,244 | 2.8% |
[ 1.5% - 2.0% ] 1.87% | 43,194 | 2.9% |
[ 2.0% - 2.5% ] 2.27% | 15,093 | 3.9% |
[ 2.5% - 3.0% ] 2.64% | 6,297 | 4.6% |
[ 3.0% - 3.5% ] 3.18% | 9,992 | 1.7% |
[ 3.5% - 4.0% ] 3.51% | 7,493 | 4.5% |
[ 4.0% - 4.5% ] 4.09% | 8,702 | 2.3% |
[ 4.0% - 4.5% ] 4.44% | 2,409 | 6.7% |
[ 4.5% - 5.0% ] 4.73% | 3,593 | 4.5% |
[ 5.5% - 6.0% ] 5.70% | 2,651 | 2.5% |
[ 6.5% - 7.0% ] 6.92% | 1,603 | 6.1% |
[ 7.0% - 7.5% ] 7.26% | 1,680 | 5.7% |
[ 8.5% - 9.0% ] 8.70% | 92 | 13.0% |
[ 9.5% - 10.0% ] 9.58% | 4,654 | 1.1% |
[ 9.5% - 10.0% ] 9.72% | 1,132 | 0.57% |
[ 11.5% - 12.0% ] 11.50% | 113 | 0.92% |
[ 12.0% - 12.5% ] 12.12% | 1,692 | 3.0% |
[ 15.0% - 15.5% ] 15.35% | 391 | 3.0% |
[ 26.5% - 27.0% ] 26.58% | 1,125 | 1.2% |
[ 67.0% - 67.5% ] 67.20% | 2,064 | 3.2% |
[ 70.5% - 71.0% ] 70.81% | 966 | 1.4% |
[ 71.5% - 72.0% ] 71.99% | 3,038 | 2.2% |