Cheyenne GED/Equivalency

COMPARE

Cheyenne
Race
Ancestry
AfghanAfricanAlaska NativeAlaskan AthabascanAlbanianAleutAlsatianAmericanApacheArabArapahoArgentineanArmenianAssyrian/Chaldean/SyriacAustralianAustrianBahamianBangladeshiBarbadianBasqueBelgianBelizeanBermudanBhutaneseBlackfeetBolivianBrazilianBritishBritish West IndianBulgarianBurmeseCajunCambodianCanadianCape VerdeanCarpatho RusynCelticCentral AmericanCentral American IndianCherokeeCheyenneChickasawChileanChineseChippewaChoctawColombianColvilleComancheCosta RicanCreeCreekCroatianCrowCubanCypriotCzechCzechoslovakianDanishDelawareDominicanDutchDutch West IndianEastern EuropeanEcuadorianEgyptianEnglishEstonianEthiopianEuropeanFijianFilipinoFinnishFrenchFrench American IndianFrench CanadianGermanGerman RussianGhanaianGreekGuamanian/ChamorroGuatemalanGuyaneseHaitianHmongHonduranHopiHoumaHungarianIcelanderIndian (Asian)IndonesianInupiatIranianIraqiIrishIroquoisIsraeliItalianJamaicanJapaneseJordanianKenyanKiowaKoreanLaotianLatvianLebaneseLiberianLithuanianLumbeeLuxembourgerMacedonianMalaysianMalteseMarshalleseMenomineeMexicanMexican American IndianMongolianMoroccanNative HawaiianNavajoNepaleseNew ZealanderNicaraguanNigerianNorthern EuropeanNorwegianOkinawanOsageOttawaPaiutePakistaniPalestinianPanamanianParaguayanPennsylvania GermanPeruvianPimaPolishPortuguesePotawatomiPuebloPuerto RicanPuget Sound SalishRomanianRussianSalvadoranSamoanScandinavianScotch-IrishScottishSeminoleSenegaleseSerbianShoshoneSierra LeoneanSiouxSlavicSlovakSloveneSomaliSouth AfricanSouth AmericanSouth American IndianSoviet UnionSpaniardSpanishSpanish AmericanSpanish American IndianSri LankanSubsaharan AfricanSudaneseSwedishSwissSyrianTaiwaneseThaiTlingit-HaidaTohono O'OdhamTonganTrinidadian and TobagonianTsimshianTurkishU.S. Virgin IslanderUgandanUkrainianUruguayanUteVenezuelanVietnameseWelshWest IndianYakamaYaquiYugoslavianYumanYup'ikZimbabwean
Immigration
NonimmigrantsImmigrantsAfghanistanAfricaAlbaniaArgentinaArmeniaAsiaAustraliaAustriaBahamasBangladeshBarbadosBelarusBelgiumBelizeBoliviaBosnia and HerzegovinaBrazilBulgariaBurma/MyanmarCabo VerdeCambodiaCameroonCanadaCaribbeanCentral AmericaChileChinaColombiaCongoCosta RicaCroatiaCubaCzechoslovakiaDenmarkDominicaDominican RepublicEastern AfricaEastern AsiaEastern EuropeEcuadorEgyptEl SalvadorEnglandEritreaEthiopiaEuropeFijiFranceGermanyGhanaGreeceGrenadaGuatemalaGuyanaHaitiHondurasHong KongHungaryIndiaIndonesiaIranIraqIrelandIsraelItalyJamaicaJapanJordanKazakhstanKenyaKoreaKuwaitLaosLatin AmericaLatviaLebanonLiberiaLithuaniaMalaysiaMexicoMicronesiaMiddle AfricaMoldovaMoroccoNepalNetherlandsNicaraguaNigeriaNorth AmericaNorth MacedoniaNorthern AfricaNorthern EuropeNorwayOceaniaPakistanPanamaPeruPhilippinesPolandPortugalRomaniaRussiaSaudi ArabiaScotlandSenegalSerbiaSierra LeoneSingaporeSomaliaSouth AfricaSouth AmericaSouth Central AsiaSouth Eastern AsiaSouthern EuropeSpainSri LankaSt. Vincent and the GrenadinesSudanSwedenSwitzerlandSyriaTaiwanThailandTrinidad and TobagoTurkeyUgandaUkraineUruguayUzbekistanVenezuelaVietnamWest IndiesWestern AfricaWestern AsiaWestern EuropeYemenZaireZimbabweAzores
Select to Compare
Race
Ancestry
AfghanAfricanAlaska NativeAlaskan AthabascanAlbanianAleutAlsatianAmericanApacheArabArapahoArgentineanArmenianAssyrian/Chaldean/SyriacAustralianAustrianBahamianBangladeshiBarbadianBasqueBelgianBelizeanBermudanBhutaneseBlackfeetBolivianBrazilianBritishBritish West IndianBulgarianBurmeseCajunCambodianCanadianCape VerdeanCarpatho RusynCelticCentral AmericanCentral American IndianCherokeeChickasawChileanChineseChippewaChoctawColombianColvilleComancheCosta RicanCreeCreekCroatianCrowCubanCypriotCzechCzechoslovakianDanishDelawareDominicanDutchDutch West IndianEastern EuropeanEcuadorianEgyptianEnglishEstonianEthiopianEuropeanFijianFilipinoFinnishFrenchFrench American IndianFrench CanadianGermanGerman RussianGhanaianGreekGuamanian/ChamorroGuatemalanGuyaneseHaitianHmongHonduranHopiHoumaHungarianIcelanderIndian (Asian)IndonesianInupiatIranianIraqiIrishIroquoisIsraeliItalianJamaicanJapaneseJordanianKenyanKiowaKoreanLaotianLatvianLebaneseLiberianLithuanianLumbeeLuxembourgerMacedonianMalaysianMalteseMarshalleseMenomineeMexicanMexican American IndianMongolianMoroccanNative HawaiianNavajoNepaleseNew ZealanderNicaraguanNigerianNorthern EuropeanNorwegianOkinawanOsageOttawaPaiutePakistaniPalestinianPanamanianParaguayanPennsylvania GermanPeruvianPimaPolishPortuguesePotawatomiPuebloPuerto RicanPuget Sound SalishRomanianRussianSalvadoranSamoanScandinavianScotch-IrishScottishSeminoleSenegaleseSerbianShoshoneSierra LeoneanSiouxSlavicSlovakSloveneSomaliSouth AfricanSouth AmericanSouth American IndianSoviet UnionSpaniardSpanishSpanish AmericanSpanish American IndianSri LankanSubsaharan AfricanSudaneseSwedishSwissSyrianTaiwaneseThaiTlingit-HaidaTohono O'OdhamTonganTrinidadian and TobagonianTsimshianTurkishU.S. Virgin IslanderUgandanUkrainianUruguayanUteVenezuelanVietnameseWelshWest IndianYakamaYaquiYugoslavianYumanYup'ikZimbabwean
Immigration
NonimmigrantsImmigrantsAfghanistanAfricaAlbaniaArgentinaArmeniaAsiaAustraliaAustriaBahamasBangladeshBarbadosBelarusBelgiumBelizeBoliviaBosnia and HerzegovinaBrazilBulgariaBurma/MyanmarCabo VerdeCambodiaCameroonCanadaCaribbeanCentral AmericaChileChinaColombiaCongoCosta RicaCroatiaCubaCzechoslovakiaDenmarkDominicaDominican RepublicEastern AfricaEastern AsiaEastern EuropeEcuadorEgyptEl SalvadorEnglandEritreaEthiopiaEuropeFijiFranceGermanyGhanaGreeceGrenadaGuatemalaGuyanaHaitiHondurasHong KongHungaryIndiaIndonesiaIranIraqIrelandIsraelItalyJamaicaJapanJordanKazakhstanKenyaKoreaKuwaitLaosLatin AmericaLatviaLebanonLiberiaLithuaniaMalaysiaMexicoMicronesiaMiddle AfricaMoldovaMoroccoNepalNetherlandsNicaraguaNigeriaNorth AmericaNorth MacedoniaNorthern AfricaNorthern EuropeNorwayOceaniaPakistanPanamaPeruPhilippinesPolandPortugalRomaniaRussiaSaudi ArabiaScotlandSenegalSerbiaSierra LeoneSingaporeSomaliaSouth AfricaSouth AmericaSouth Central AsiaSouth Eastern AsiaSouthern EuropeSpainSri LankaSt. Vincent and the GrenadinesSudanSwedenSwitzerlandSyriaTaiwanThailandTrinidad and TobagoTurkeyUgandaUkraineUruguayUzbekistanVenezuelaVietnamWest IndiesWestern AfricaWestern AsiaWestern EuropeYemenZaireZimbabweAzores
GED/Equivalency
Income
Poverty
Unemployment
Labor Participation
Family Structure
Vehicle Availability
Education Level
Disability

Cheyenne GED/Equivalency
Tragic

82.7%
GED/EQUIVALENCY
0.1/ 100
METRIC RATING
280th/ 347
METRIC RANK

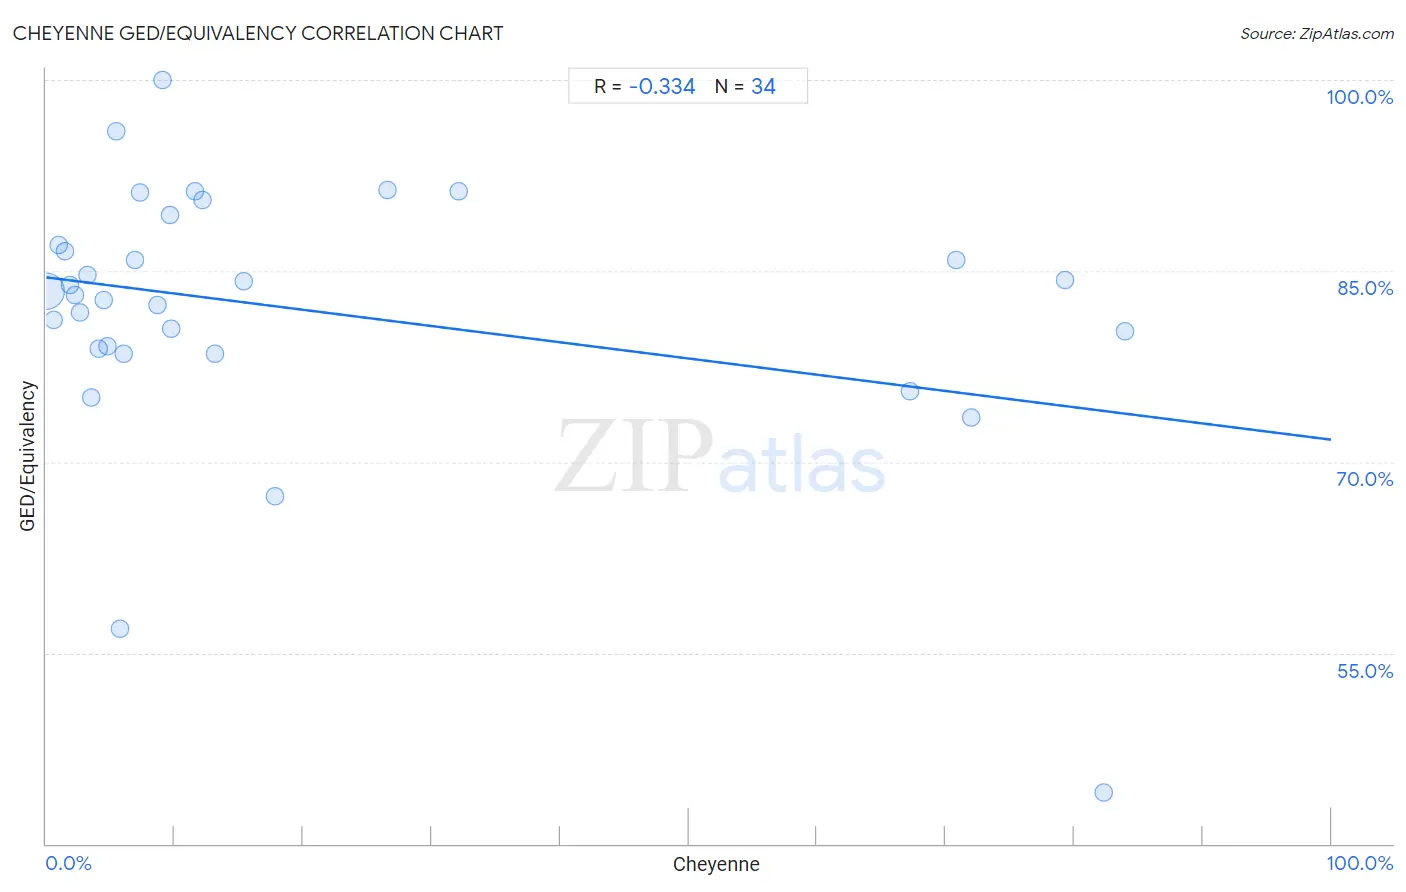
Cheyenne GED/Equivalency Correlation Chart

The statistical analysis conducted on geographies consisting of 80,719,411 people shows a mild negative correlation between the proportion of Cheyenne and percentage of population with at least ged/equivalency education in the United States with a correlation coefficient (R) of -0.334 and weighted average of 82.7%. On average, for every 1% (one percent) increase in Cheyenne within a typical geography, there is a decrease of 0.13% in percentage of population with at least ged/equivalency education.
Cheyenne GED/Equivalency
It is essential to understand that the correlation between the percentage of Cheyenne and percentage of population with at least ged/equivalency education does not imply a direct cause-and-effect relationship. It remains uncertain whether the presence of Cheyenne influences an upward or downward trend in the level of percentage of population with at least ged/equivalency education within an area, or if Cheyenne simply ended up residing in those areas with higher or lower levels of percentage of population with at least ged/equivalency education due to other factors.

Demographics Similar to Cheyenne by GED/Equivalency

In terms of ged/equivalency, the demographic groups most similar to Cheyenne are Immigrants from Laos (82.7%, a difference of 0.010%), Immigrants from Fiji (82.7%, a difference of 0.010%), Arapaho (82.8%, a difference of 0.050%), Black/African American (82.8%, a difference of 0.060%), and Seminole (82.8%, a difference of 0.090%).
DemographicsRating | RankGED/Equivalency
Pennsylvania Germans
0.1
/100
|
#273
Tragic
82.9%
Immigrants from Trinidad and Tobago
0.1
/100
|
#274
Tragic
82.8%
Seminole
0.1
/100
|
#275
Tragic
82.8%
Blacks/African Americans
0.1
/100
|
#276
Tragic
82.8%
Arapaho
0.1
/100
|
#277
Tragic
82.8%
Immigrants from Laos
0.1
/100
|
#278
Tragic
82.7%
Immigrants from Fiji
0.1
/100
|
#279
Tragic
82.7%
Cheyenne
0.1
/100
|
#280
Tragic
82.7%
Sioux
0.1
/100
|
#281
Tragic
82.6%
Immigrants
0.1
/100
|
#282
Tragic
82.6%
Indonesians
0.1
/100
|
#283
Tragic
82.5%
Immigrants from Barbados
0.1
/100
|
#284
Tragic
82.4%
Cajuns
0.0
/100
|
#285
Tragic
82.4%
Immigrants from West Indies
0.0
/100
|
#286
Tragic
82.4%
Japanese
0.0
/100
|
#287
Tragic
82.4%

Cheyenne GED/Equivalency Correlation Summary

MeasurementCheyenne DataGED/Equivalency Data
Minimum0.026%44.1%
Maximum84.0%100.0%
Range83.9%55.9%
Mean20.1%81.9%
Median8.0%83.3%
Interquartile 25% (IQ1)3.5%78.8%
Interquartile 75% (IQ3)17.8%87.0%
Interquartile Range (IQR)14.3%8.2%
Standard Deviation (Sample)27.3%10.4%
Standard Deviation (Population)26.8%10.3%

Correlation Details

Cheyenne PercentileSample SizeGED/Equivalency
[
0.0%
-
0.5%
]
0.026%
79,658,07483.4%
[
0.5%
-
1.0%
]
0.58%
519,39081.1%
[
1.0%
-
1.5%
]
1.00%
369,16787.0%
[
1.0%
-
1.5%
]
1.44%
50,62486.6%
[
1.5%
-
2.0%
]
1.87%
43,19483.9%
[
2.0%
-
2.5%
]
2.27%
15,56683.1%
[
2.5%
-
3.0%
]
2.64%
6,29781.7%
[
3.0%
-
3.5%
]
3.18%
10,26484.6%
[
3.5%
-
4.0%
]
3.51%
7,49375.1%
[
4.0%
-
4.5%
]
4.09%
8,70278.8%
[
4.0%
-
4.5%
]
4.44%
2,61182.7%
[
4.5%
-
5.0%
]
4.73%
3,59379.1%
[
5.0%
-
5.5%
]
5.45%
22096.0%
[
5.5%
-
6.0%
]
5.70%
2,65156.9%
[
6.0%
-
6.5%
]
6.06%
29778.5%
[
6.5%
-
7.0%
]
6.92%
1,60385.9%
[
7.0%
-
7.5%
]
7.26%
1,68091.1%
[
8.5%
-
9.0%
]
8.70%
9282.4%
[
9.0%
-
9.5%
]
9.00%
100100.0%
[
9.5%
-
10.0%
]
9.58%
4,65489.4%
[
9.5%
-
10.0%
]
9.72%
1,13280.5%
[
11.5%
-
12.0%
]
11.56%
17391.3%
[
12.0%
-
12.5%
]
12.12%
1,69290.5%
[
13.0%
-
13.5%
]
13.18%
38778.5%
[
15.0%
-
15.5%
]
15.35%
39184.2%
[
17.5%
-
18.0%
]
17.83%
12967.3%
[
26.5%
-
27.0%
]
26.58%
1,12591.4%
[
32.0%
-
32.5%
]
32.06%
78391.2%
[
67.0%
-
67.5%
]
67.20%
2,06475.5%
[
70.5%
-
71.0%
]
70.81%
96685.9%
[
71.5%
-
72.0%
]
71.99%
3,03873.5%
[
79.0%
-
79.5%
]
79.32%
47484.3%
[
82.0%
-
82.5%
]
82.26%
12444.1%
[
83.5%
-
84.0%
]
83.96%
66180.3%