Cheyenne Receiving Food Stamps

COMPARE

Cheyenne
Race
Ancestry
AfghanAfricanAlaska NativeAlaskan AthabascanAlbanianAleutAlsatianAmericanApacheArabArapahoArgentineanArmenianAssyrian/Chaldean/SyriacAustralianAustrianBahamianBangladeshiBarbadianBasqueBelgianBelizeanBermudanBhutaneseBlackfeetBolivianBrazilianBritishBritish West IndianBulgarianBurmeseCajunCambodianCanadianCape VerdeanCarpatho RusynCelticCentral AmericanCentral American IndianCherokeeCheyenneChickasawChileanChineseChippewaChoctawColombianColvilleComancheCosta RicanCreeCreekCroatianCrowCubanCypriotCzechCzechoslovakianDanishDelawareDominicanDutchDutch West IndianEastern EuropeanEcuadorianEgyptianEnglishEstonianEthiopianEuropeanFijianFilipinoFinnishFrenchFrench American IndianFrench CanadianGermanGerman RussianGhanaianGreekGuamanian/ChamorroGuatemalanGuyaneseHaitianHmongHonduranHopiHoumaHungarianIcelanderIndian (Asian)IndonesianInupiatIranianIraqiIrishIroquoisIsraeliItalianJamaicanJapaneseJordanianKenyanKiowaKoreanLaotianLatvianLebaneseLiberianLithuanianLumbeeLuxembourgerMacedonianMalaysianMalteseMarshalleseMenomineeMexicanMexican American IndianMongolianMoroccanNative HawaiianNavajoNepaleseNew ZealanderNicaraguanNigerianNorthern EuropeanNorwegianOkinawanOsageOttawaPaiutePakistaniPalestinianPanamanianParaguayanPennsylvania GermanPeruvianPimaPolishPortuguesePotawatomiPuebloPuerto RicanPuget Sound SalishRomanianRussianSalvadoranSamoanScandinavianScotch-IrishScottishSeminoleSenegaleseSerbianShoshoneSierra LeoneanSiouxSlavicSlovakSloveneSomaliSouth AfricanSouth AmericanSouth American IndianSoviet UnionSpaniardSpanishSpanish AmericanSpanish American IndianSri LankanSubsaharan AfricanSudaneseSwedishSwissSyrianTaiwaneseThaiTlingit-HaidaTohono O'OdhamTonganTrinidadian and TobagonianTsimshianTurkishU.S. Virgin IslanderUgandanUkrainianUruguayanUteVenezuelanVietnameseWelshWest IndianYakamaYaquiYugoslavianYumanYup'ikZimbabwean
Immigration
NonimmigrantsImmigrantsAfghanistanAfricaAlbaniaArgentinaArmeniaAsiaAustraliaAustriaBahamasBangladeshBarbadosBelarusBelgiumBelizeBoliviaBosnia and HerzegovinaBrazilBulgariaBurma/MyanmarCabo VerdeCambodiaCameroonCanadaCaribbeanCentral AmericaChileChinaColombiaCongoCosta RicaCroatiaCubaCzechoslovakiaDenmarkDominicaDominican RepublicEastern AfricaEastern AsiaEastern EuropeEcuadorEgyptEl SalvadorEnglandEritreaEthiopiaEuropeFijiFranceGermanyGhanaGreeceGrenadaGuatemalaGuyanaHaitiHondurasHong KongHungaryIndiaIndonesiaIranIraqIrelandIsraelItalyJamaicaJapanJordanKazakhstanKenyaKoreaKuwaitLaosLatin AmericaLatviaLebanonLiberiaLithuaniaMalaysiaMexicoMicronesiaMiddle AfricaMoldovaMoroccoNepalNetherlandsNicaraguaNigeriaNorth AmericaNorth MacedoniaNorthern AfricaNorthern EuropeNorwayOceaniaPakistanPanamaPeruPhilippinesPolandPortugalRomaniaRussiaSaudi ArabiaScotlandSenegalSerbiaSierra LeoneSingaporeSomaliaSouth AfricaSouth AmericaSouth Central AsiaSouth Eastern AsiaSouthern EuropeSpainSri LankaSt. Vincent and the GrenadinesSudanSwedenSwitzerlandSyriaTaiwanThailandTrinidad and TobagoTurkeyUgandaUkraineUruguayUzbekistanVenezuelaVietnamWest IndiesWestern AfricaWestern AsiaWestern EuropeYemenZaireZimbabweAzores
Select to Compare
Race
Ancestry
AfghanAfricanAlaska NativeAlaskan AthabascanAlbanianAleutAlsatianAmericanApacheArabArapahoArgentineanArmenianAssyrian/Chaldean/SyriacAustralianAustrianBahamianBangladeshiBarbadianBasqueBelgianBelizeanBermudanBhutaneseBlackfeetBolivianBrazilianBritishBritish West IndianBulgarianBurmeseCajunCambodianCanadianCape VerdeanCarpatho RusynCelticCentral AmericanCentral American IndianCherokeeChickasawChileanChineseChippewaChoctawColombianColvilleComancheCosta RicanCreeCreekCroatianCrowCubanCypriotCzechCzechoslovakianDanishDelawareDominicanDutchDutch West IndianEastern EuropeanEcuadorianEgyptianEnglishEstonianEthiopianEuropeanFijianFilipinoFinnishFrenchFrench American IndianFrench CanadianGermanGerman RussianGhanaianGreekGuamanian/ChamorroGuatemalanGuyaneseHaitianHmongHonduranHopiHoumaHungarianIcelanderIndian (Asian)IndonesianInupiatIranianIraqiIrishIroquoisIsraeliItalianJamaicanJapaneseJordanianKenyanKiowaKoreanLaotianLatvianLebaneseLiberianLithuanianLumbeeLuxembourgerMacedonianMalaysianMalteseMarshalleseMenomineeMexicanMexican American IndianMongolianMoroccanNative HawaiianNavajoNepaleseNew ZealanderNicaraguanNigerianNorthern EuropeanNorwegianOkinawanOsageOttawaPaiutePakistaniPalestinianPanamanianParaguayanPennsylvania GermanPeruvianPimaPolishPortuguesePotawatomiPuebloPuerto RicanPuget Sound SalishRomanianRussianSalvadoranSamoanScandinavianScotch-IrishScottishSeminoleSenegaleseSerbianShoshoneSierra LeoneanSiouxSlavicSlovakSloveneSomaliSouth AfricanSouth AmericanSouth American IndianSoviet UnionSpaniardSpanishSpanish AmericanSpanish American IndianSri LankanSubsaharan AfricanSudaneseSwedishSwissSyrianTaiwaneseThaiTlingit-HaidaTohono O'OdhamTonganTrinidadian and TobagonianTsimshianTurkishU.S. Virgin IslanderUgandanUkrainianUruguayanUteVenezuelanVietnameseWelshWest IndianYakamaYaquiYugoslavianYumanYup'ikZimbabwean
Immigration
NonimmigrantsImmigrantsAfghanistanAfricaAlbaniaArgentinaArmeniaAsiaAustraliaAustriaBahamasBangladeshBarbadosBelarusBelgiumBelizeBoliviaBosnia and HerzegovinaBrazilBulgariaBurma/MyanmarCabo VerdeCambodiaCameroonCanadaCaribbeanCentral AmericaChileChinaColombiaCongoCosta RicaCroatiaCubaCzechoslovakiaDenmarkDominicaDominican RepublicEastern AfricaEastern AsiaEastern EuropeEcuadorEgyptEl SalvadorEnglandEritreaEthiopiaEuropeFijiFranceGermanyGhanaGreeceGrenadaGuatemalaGuyanaHaitiHondurasHong KongHungaryIndiaIndonesiaIranIraqIrelandIsraelItalyJamaicaJapanJordanKazakhstanKenyaKoreaKuwaitLaosLatin AmericaLatviaLebanonLiberiaLithuaniaMalaysiaMexicoMicronesiaMiddle AfricaMoldovaMoroccoNepalNetherlandsNicaraguaNigeriaNorth AmericaNorth MacedoniaNorthern AfricaNorthern EuropeNorwayOceaniaPakistanPanamaPeruPhilippinesPolandPortugalRomaniaRussiaSaudi ArabiaScotlandSenegalSerbiaSierra LeoneSingaporeSomaliaSouth AfricaSouth AmericaSouth Central AsiaSouth Eastern AsiaSouthern EuropeSpainSri LankaSt. Vincent and the GrenadinesSudanSwedenSwitzerlandSyriaTaiwanThailandTrinidad and TobagoTurkeyUgandaUkraineUruguayUzbekistanVenezuelaVietnamWest IndiesWestern AfricaWestern AsiaWestern EuropeYemenZaireZimbabweAzores
Receiving Food Stamps
Income
Poverty
Unemployment
Labor Participation
Family Structure
Vehicle Availability
Education Level
Disability

Cheyenne Receiving Food Stamps
Tragic

14.3%
PUBLIC INCOME | FOOD STAMPS
0.2/ 100
METRIC RATING
266th/ 347
METRIC RANK

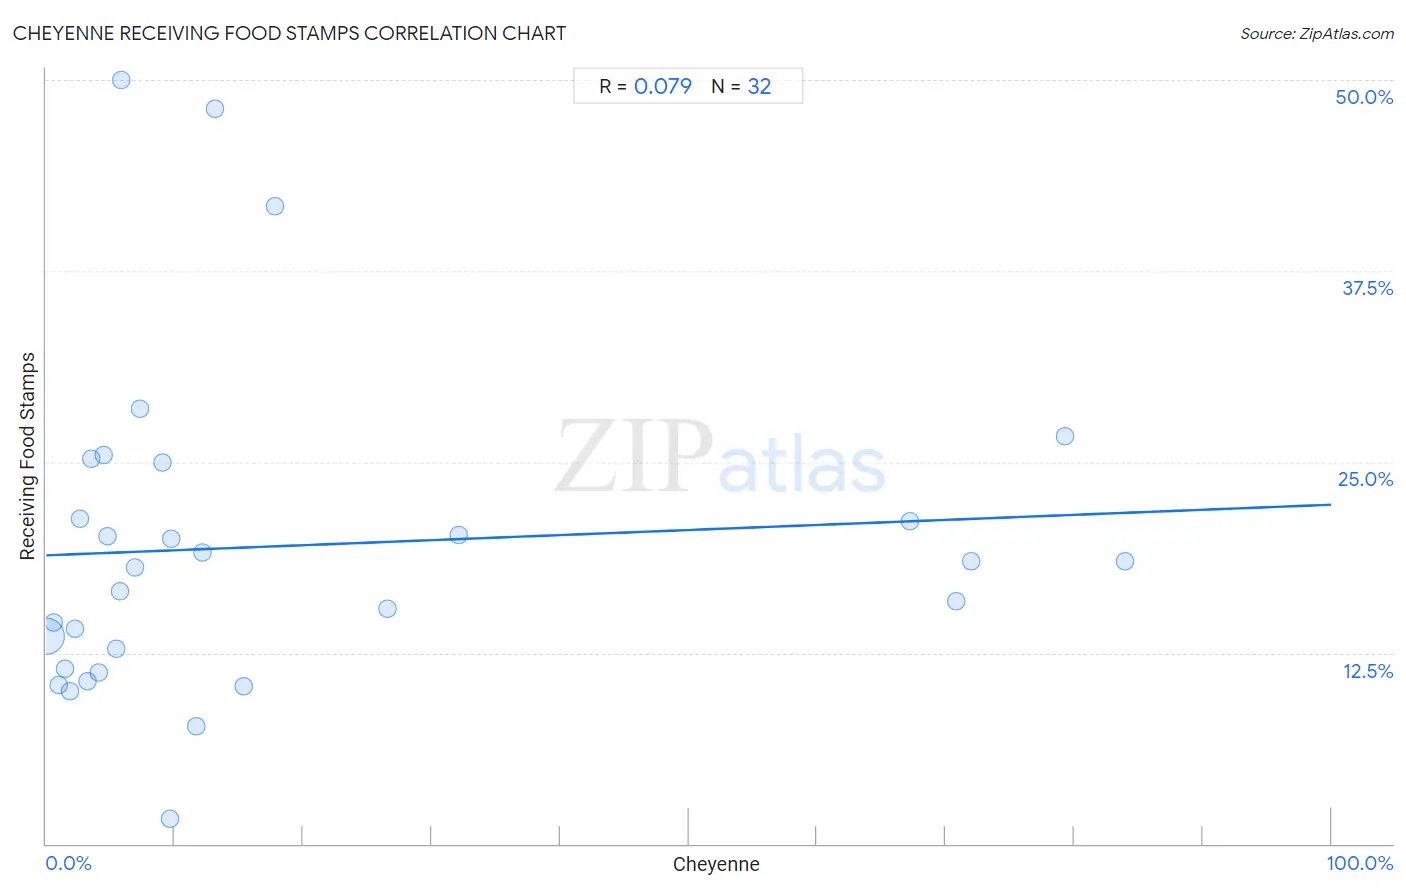
Cheyenne Receiving Food Stamps Correlation Chart

The statistical analysis conducted on geographies consisting of 80,695,470 people shows a slight positive correlation between the proportion of Cheyenne and percentage of population receiving government assistance and/or food stamps in the United States with a correlation coefficient (R) of 0.079 and weighted average of 14.3%. On average, for every 1% (one percent) increase in Cheyenne within a typical geography, there is an increase of 0.033% in percentage of population receiving government assistance and/or food stamps.
Cheyenne Receiving Food Stamps
It is essential to understand that the correlation between the percentage of Cheyenne and percentage of population receiving government assistance and/or food stamps does not imply a direct cause-and-effect relationship. It remains uncertain whether the presence of Cheyenne influences an upward or downward trend in the level of percentage of population receiving government assistance and/or food stamps within an area, or if Cheyenne simply ended up residing in those areas with higher or lower levels of percentage of population receiving government assistance and/or food stamps due to other factors.

Demographics Similar to Cheyenne by Receiving Food Stamps

In terms of receiving food stamps, the demographic groups most similar to Cheyenne are Blackfeet (14.3%, a difference of 0.080%), Immigrants from Uzbekistan (14.3%, a difference of 0.14%), Dutch West Indian (14.3%, a difference of 0.22%), Paiute (14.3%, a difference of 0.23%), and Immigrants from Portugal (14.3%, a difference of 0.23%).
DemographicsRating | RankReceiving Food Stamps
Creek
0.3
/100
|
#259
Tragic
14.1%
Central Americans
0.3
/100
|
#260
Tragic
14.1%
Immigrants from Congo
0.3
/100
|
#261
Tragic
14.1%
Paiute
0.2
/100
|
#262
Tragic
14.3%
Immigrants from Portugal
0.2
/100
|
#263
Tragic
14.3%
Immigrants from Uzbekistan
0.2
/100
|
#264
Tragic
14.3%
Blackfeet
0.2
/100
|
#265
Tragic
14.3%
Cheyenne
0.2
/100
|
#266
Tragic
14.3%
Dutch West Indians
0.2
/100
|
#267
Tragic
14.3%
Guatemalans
0.1
/100
|
#268
Tragic
14.4%
Nepalese
0.1
/100
|
#269
Tragic
14.6%
Mexicans
0.1
/100
|
#270
Tragic
14.6%
Immigrants from Guatemala
0.1
/100
|
#271
Tragic
14.6%
Chippewa
0.1
/100
|
#272
Tragic
14.7%
Alaskan Athabascans
0.1
/100
|
#273
Tragic
14.7%

Cheyenne Receiving Food Stamps Correlation Summary

MeasurementCheyenne DataReceiving Food Stamps Data
Minimum0.026%1.6%
Maximum84.0%50.0%
Range83.9%48.4%
Mean18.5%19.5%
Median7.1%18.3%
Interquartile 25% (IQ1)3.3%12.1%
Interquartile 75% (IQ3)16.6%23.2%
Interquartile Range (IQR)13.2%11.0%
Standard Deviation (Sample)25.7%10.8%
Standard Deviation (Population)25.3%10.6%

Correlation Details

Cheyenne PercentileSample SizeReceiving Food Stamps
[
0.0%
-
0.5%
]
0.026%
79,639,32513.6%
[
0.5%
-
1.0%
]
0.58%
518,07214.5%
[
1.0%
-
1.5%
]
1.00%
367,88710.4%
[
1.0%
-
1.5%
]
1.44%
50,08011.5%
[
1.5%
-
2.0%
]
1.86%
42,26910.0%
[
2.0%
-
2.5%
]
2.27%
15,56614.1%
[
2.5%
-
3.0%
]
2.64%
6,29721.3%
[
3.0%
-
3.5%
]
3.19%
9,79010.7%
[
3.5%
-
4.0%
]
3.51%
7,38325.2%
[
4.0%
-
4.5%
]
4.09%
8,70211.2%
[
4.0%
-
4.5%
]
4.44%
2,61125.5%
[
4.5%
-
5.0%
]
4.73%
3,59320.1%
[
5.0%
-
5.5%
]
5.45%
22012.8%
[
5.5%
-
6.0%
]
5.70%
2,65116.5%
[
5.5%
-
6.0%
]
5.88%
8550.0%
[
6.5%
-
7.0%
]
6.92%
1,60318.1%
[
7.0%
-
7.5%
]
7.26%
1,68028.5%
[
9.0%
-
9.5%
]
9.00%
10025.0%
[
9.5%
-
10.0%
]
9.58%
4,6541.6%
[
9.5%
-
10.0%
]
9.72%
1,13220.0%
[
11.5%
-
12.0%
]
11.67%
607.7%
[
12.0%
-
12.5%
]
12.12%
1,69219.1%
[
13.0%
-
13.5%
]
13.18%
38748.1%
[
15.0%
-
15.5%
]
15.35%
39110.3%
[
17.5%
-
18.0%
]
17.83%
12941.7%
[
26.5%
-
27.0%
]
26.58%
1,12515.4%
[
32.0%
-
32.5%
]
32.06%
78320.2%
[
67.0%
-
67.5%
]
67.20%
2,06421.1%
[
70.5%
-
71.0%
]
70.81%
96615.9%
[
71.5%
-
72.0%
]
71.99%
3,03818.5%
[
79.0%
-
79.5%
]
79.32%
47426.7%
[
83.5%
-
84.0%
]
83.96%
66118.5%