Salvadoran Self-Care Disability
COMPARE
Salvadoran
Select to Compare
Self-Care Disability
Salvadoran Self-Care Disability
2.5%
SELF-CARE DISABILITY
36.4/ 100
METRIC RATING
183rd/ 347
METRIC RANK
Salvadoran Self-Care Disability Correlation Chart
The statistical analysis conducted on geographies consisting of 398,444,194 people shows a substantial negative correlation between the proportion of Salvadorans and percentage of population with self-care disability in the United States with a correlation coefficient (R) of -0.536 and weighted average of 2.5%. On average, for every 1% (one percent) increase in Salvadorans within a typical geography, there is a decrease of 0.042% in percentage of population with self-care disability.
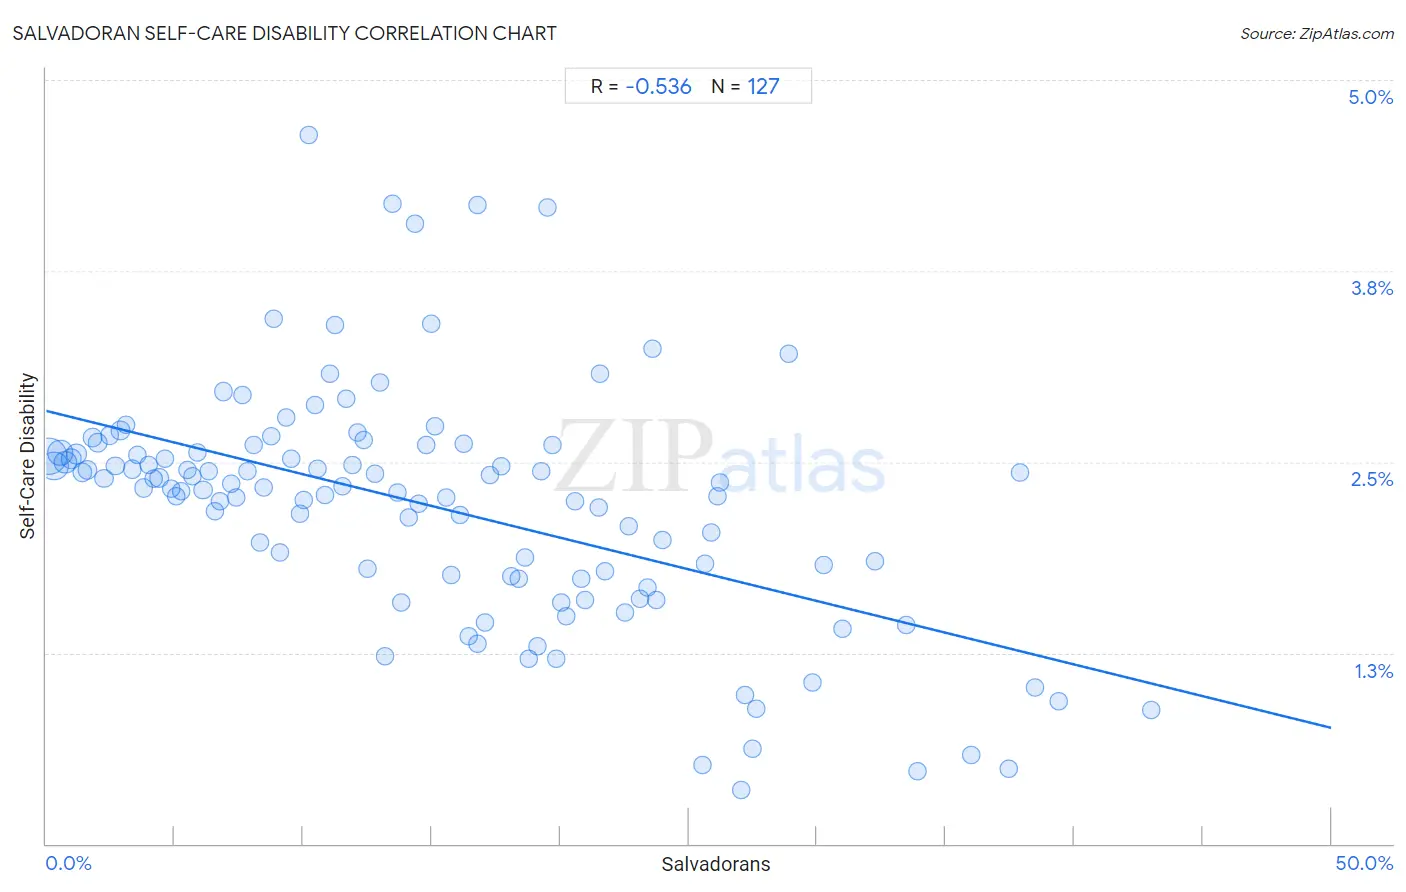
It is essential to understand that the correlation between the percentage of Salvadorans and percentage of population with self-care disability does not imply a direct cause-and-effect relationship. It remains uncertain whether the presence of Salvadorans influences an upward or downward trend in the level of percentage of population with self-care disability within an area, or if Salvadorans simply ended up residing in those areas with higher or lower levels of percentage of population with self-care disability due to other factors.
Demographics Similar to Salvadorans by Self-Care Disability
In terms of self-care disability, the demographic groups most similar to Salvadorans are Yugoslavian (2.5%, a difference of 0.020%), Maltese (2.5%, a difference of 0.050%), Slavic (2.5%, a difference of 0.11%), Immigrants from El Salvador (2.5%, a difference of 0.18%), and Ghanaian (2.5%, a difference of 0.20%).
| Demographics | Rating | Rank | Self-Care Disability |
| Immigrants from Afghanistan | 47.6 /100 | #176 | Average 2.5% |
| Immigrants from Kazakhstan | 46.7 /100 | #177 | Average 2.5% |
| English | 46.2 /100 | #178 | Average 2.5% |
| Hungarians | 45.5 /100 | #179 | Average 2.5% |
| Indonesians | 41.2 /100 | #180 | Average 2.5% |
| Ghanaians | 40.4 /100 | #181 | Average 2.5% |
| Maltese | 37.5 /100 | #182 | Fair 2.5% |
| Salvadorans | 36.4 /100 | #183 | Fair 2.5% |
| Yugoslavians | 36.1 /100 | #184 | Fair 2.5% |
| Slavs | 34.3 /100 | #185 | Fair 2.5% |
| Immigrants from El Salvador | 33.0 /100 | #186 | Fair 2.5% |
| Irish | 28.7 /100 | #187 | Fair 2.5% |
| Immigrants from Oceania | 28.3 /100 | #188 | Fair 2.5% |
| Immigrants from Eastern Europe | 28.0 /100 | #189 | Fair 2.5% |
| Sioux | 24.6 /100 | #190 | Fair 2.5% |
Salvadoran Self-Care Disability Correlation Summary
| Measurement | Salvadoran Data | Self-Care Disability Data |
| Minimum | 0.098% | 0.35% |
| Maximum | 43.0% | 4.6% |
| Range | 42.9% | 4.3% |
| Mean | 15.0% | 2.2% |
| Median | 13.7% | 2.3% |
| Interquartile 25% (IQ1) | 6.8% | 1.8% |
| Interquartile 75% (IQ3) | 21.5% | 2.6% |
| Interquartile Range (IQR) | 14.7% | 0.81% |
| Standard Deviation (Sample) | 10.0% | 0.78% |
| Standard Deviation (Population) | 10.0% | 0.77% |
Correlation Details
| Salvadoran Percentile | Sample Size | Self-Care Disability |
[ 0.0% - 0.5% ] 0.098% | 130,171,121 | 2.5% |
[ 0.0% - 0.5% ] 0.31% | 74,351,524 | 2.5% |
[ 0.5% - 1.0% ] 0.54% | 48,814,356 | 2.6% |
[ 0.5% - 1.0% ] 0.74% | 29,155,824 | 2.5% |
[ 0.5% - 1.0% ] 0.97% | 17,162,667 | 2.5% |
[ 1.0% - 1.5% ] 1.17% | 13,527,388 | 2.5% |
[ 1.0% - 1.5% ] 1.40% | 10,479,545 | 2.4% |
[ 1.5% - 2.0% ] 1.61% | 10,293,579 | 2.4% |
[ 1.5% - 2.0% ] 1.82% | 8,153,292 | 2.7% |
[ 2.0% - 2.5% ] 2.01% | 6,000,666 | 2.6% |
[ 2.0% - 2.5% ] 2.24% | 4,566,307 | 2.4% |
[ 2.0% - 2.5% ] 2.48% | 4,337,815 | 2.7% |
[ 2.5% - 3.0% ] 2.68% | 4,071,044 | 2.5% |
[ 2.5% - 3.0% ] 2.89% | 2,620,017 | 2.7% |
[ 3.0% - 3.5% ] 3.12% | 2,748,031 | 2.7% |
[ 3.0% - 3.5% ] 3.34% | 2,121,667 | 2.5% |
[ 3.5% - 4.0% ] 3.56% | 1,928,086 | 2.5% |
[ 3.5% - 4.0% ] 3.78% | 1,677,179 | 2.3% |
[ 3.5% - 4.0% ] 3.99% | 1,294,450 | 2.5% |
[ 4.0% - 4.5% ] 4.19% | 1,060,718 | 2.4% |
[ 4.0% - 4.5% ] 4.39% | 3,054,255 | 2.4% |
[ 4.5% - 5.0% ] 4.62% | 895,536 | 2.5% |
[ 4.5% - 5.0% ] 4.85% | 928,400 | 2.3% |
[ 5.0% - 5.5% ] 5.05% | 641,031 | 2.3% |
[ 5.0% - 5.5% ] 5.26% | 897,408 | 2.3% |
[ 5.0% - 5.5% ] 5.50% | 876,625 | 2.4% |
[ 5.5% - 6.0% ] 5.68% | 538,755 | 2.4% |
[ 5.5% - 6.0% ] 5.89% | 417,979 | 2.6% |
[ 6.0% - 6.5% ] 6.10% | 705,523 | 2.3% |
[ 6.0% - 6.5% ] 6.32% | 504,684 | 2.4% |
[ 6.5% - 7.0% ] 6.55% | 586,959 | 2.2% |
[ 6.5% - 7.0% ] 6.77% | 445,718 | 2.2% |
[ 6.5% - 7.0% ] 6.89% | 4,233,725 | 3.0% |
[ 7.0% - 7.5% ] 7.18% | 409,732 | 2.4% |
[ 7.0% - 7.5% ] 7.40% | 204,611 | 2.3% |
[ 7.5% - 8.0% ] 7.62% | 381,514 | 2.9% |
[ 7.5% - 8.0% ] 7.83% | 449,125 | 2.4% |
[ 8.0% - 8.5% ] 8.07% | 528,222 | 2.6% |
[ 8.0% - 8.5% ] 8.32% | 111,619 | 2.0% |
[ 8.0% - 8.5% ] 8.45% | 474,844 | 2.3% |
[ 8.5% - 9.0% ] 8.76% | 278,195 | 2.7% |
[ 8.5% - 9.0% ] 8.85% | 90,983 | 3.4% |
[ 9.0% - 9.5% ] 9.11% | 460,232 | 1.9% |
[ 9.0% - 9.5% ] 9.35% | 326,192 | 2.8% |
[ 9.5% - 10.0% ] 9.54% | 173,122 | 2.5% |
[ 9.5% - 10.0% ] 9.85% | 33,756 | 2.2% |
[ 10.0% - 10.5% ] 10.03% | 248,031 | 2.3% |
[ 10.0% - 10.5% ] 10.20% | 101,876 | 4.6% |
[ 10.0% - 10.5% ] 10.45% | 101,006 | 2.9% |
[ 10.5% - 11.0% ] 10.57% | 171,371 | 2.5% |
[ 10.5% - 11.0% ] 10.83% | 148,515 | 2.3% |
[ 11.0% - 11.5% ] 11.06% | 253,808 | 3.1% |
[ 11.0% - 11.5% ] 11.26% | 104,223 | 3.4% |
[ 11.5% - 12.0% ] 11.51% | 64,921 | 2.3% |
[ 11.5% - 12.0% ] 11.69% | 170,020 | 2.9% |
[ 11.5% - 12.0% ] 11.91% | 224,804 | 2.5% |
[ 12.0% - 12.5% ] 12.13% | 89,488 | 2.7% |
[ 12.0% - 12.5% ] 12.37% | 236,936 | 2.6% |
[ 12.5% - 13.0% ] 12.51% | 54,358 | 1.8% |
[ 12.5% - 13.0% ] 12.81% | 65,316 | 2.4% |
[ 12.5% - 13.0% ] 13.00% | 152,703 | 3.0% |
[ 13.0% - 13.5% ] 13.19% | 108,529 | 1.2% |
[ 13.0% - 13.5% ] 13.48% | 2,626 | 4.2% |
[ 13.5% - 14.0% ] 13.66% | 130,830 | 2.3% |
[ 13.5% - 14.0% ] 13.84% | 24,963 | 1.6% |
[ 14.0% - 14.5% ] 14.11% | 114,309 | 2.1% |
[ 14.0% - 14.5% ] 14.33% | 134,582 | 4.1% |
[ 14.5% - 15.0% ] 14.51% | 140,862 | 2.2% |
[ 14.5% - 15.0% ] 14.77% | 150,733 | 2.6% |
[ 14.5% - 15.0% ] 14.99% | 147,047 | 3.4% |
[ 15.0% - 15.5% ] 15.12% | 860 | 2.7% |
[ 15.5% - 16.0% ] 15.57% | 88,776 | 2.3% |
[ 15.5% - 16.0% ] 15.77% | 50,114 | 1.8% |
[ 16.0% - 16.5% ] 16.09% | 56,628 | 2.1% |
[ 16.0% - 16.5% ] 16.23% | 142,992 | 2.6% |
[ 16.0% - 16.5% ] 16.43% | 45,208 | 1.4% |
[ 16.5% - 17.0% ] 16.76% | 57,711 | 4.2% |
[ 16.5% - 17.0% ] 16.76% | 5,697 | 1.3% |
[ 17.0% - 17.5% ] 17.09% | 32,271 | 1.4% |
[ 17.0% - 17.5% ] 17.29% | 2,719 | 2.4% |
[ 17.5% - 18.0% ] 17.71% | 67,229 | 2.5% |
[ 18.0% - 18.5% ] 18.11% | 55,960 | 1.8% |
[ 18.0% - 18.5% ] 18.39% | 63,751 | 1.7% |
[ 18.5% - 19.0% ] 18.62% | 18,346 | 1.9% |
[ 18.5% - 19.0% ] 18.75% | 63,975 | 1.2% |
[ 19.0% - 19.5% ] 19.12% | 17,123 | 1.3% |
[ 19.0% - 19.5% ] 19.27% | 38,524 | 2.4% |
[ 19.0% - 19.5% ] 19.48% | 6,811 | 4.2% |
[ 19.5% - 20.0% ] 19.69% | 83,947 | 2.6% |
[ 19.5% - 20.0% ] 19.87% | 100,019 | 1.2% |
[ 20.0% - 20.5% ] 20.03% | 56,319 | 1.6% |
[ 20.0% - 20.5% ] 20.25% | 33,927 | 1.5% |
[ 20.5% - 21.0% ] 20.60% | 61,783 | 2.2% |
[ 20.5% - 21.0% ] 20.82% | 51,837 | 1.7% |
[ 20.5% - 21.0% ] 20.98% | 53,308 | 1.6% |
[ 21.0% - 21.5% ] 21.48% | 58,557 | 2.2% |
[ 21.5% - 22.0% ] 21.56% | 19,289 | 3.1% |
[ 21.5% - 22.0% ] 21.74% | 28,660 | 1.8% |
[ 22.5% - 23.0% ] 22.52% | 14,470 | 1.5% |
[ 22.5% - 23.0% ] 22.65% | 34,625 | 2.1% |
[ 23.0% - 23.5% ] 23.12% | 19,102 | 1.6% |
[ 23.0% - 23.5% ] 23.38% | 53,349 | 1.7% |
[ 23.5% - 24.0% ] 23.60% | 19,704 | 3.2% |
[ 23.5% - 24.0% ] 23.74% | 19,233 | 1.6% |
[ 23.5% - 24.0% ] 23.95% | 27,886 | 2.0% |
[ 25.5% - 26.0% ] 25.55% | 21,778 | 0.52% |
[ 25.5% - 26.0% ] 25.64% | 35,336 | 1.8% |
[ 25.5% - 26.0% ] 25.88% | 167,043 | 2.0% |
[ 26.0% - 26.5% ] 26.12% | 82,627 | 2.3% |
[ 26.0% - 26.5% ] 26.22% | 39,875 | 2.4% |
[ 27.0% - 27.5% ] 27.05% | 3,782 | 0.35% |
[ 27.0% - 27.5% ] 27.19% | 20,627 | 0.97% |
[ 27.0% - 27.5% ] 27.47% | 22,966 | 0.62% |
[ 27.5% - 28.0% ] 27.64% | 4,617 | 0.88% |
[ 28.5% - 29.0% ] 28.89% | 8,629 | 3.2% |
[ 29.5% - 30.0% ] 29.79% | 10,563 | 1.1% |
[ 30.0% - 30.5% ] 30.25% | 10,317 | 1.8% |
[ 31.0% - 31.5% ] 31.00% | 101,422 | 1.4% |
[ 32.0% - 32.5% ] 32.26% | 1,516 | 1.8% |
[ 33.0% - 33.5% ] 33.45% | 3,312 | 1.4% |
[ 33.5% - 34.0% ] 33.91% | 14,162 | 0.47% |
[ 35.5% - 36.0% ] 35.98% | 1,751 | 0.58% |
[ 37.0% - 37.5% ] 37.43% | 12,603 | 0.49% |
[ 37.5% - 38.0% ] 37.91% | 2,118 | 2.4% |
[ 38.0% - 38.5% ] 38.45% | 684 | 1.0% |
[ 39.0% - 39.5% ] 39.40% | 1,764 | 0.93% |
[ 42.5% - 43.0% ] 42.98% | 114 | 0.88% |