Salvadoran Disability
COMPARE
Salvadoran
Select to Compare
Disability
Salvadoran Disability
10.9%
DISABILITY
99.8/ 100
METRIC RATING
57th/ 347
METRIC RANK
Salvadoran Disability Correlation Chart
The statistical analysis conducted on geographies consisting of 398,952,177 people shows a moderate negative correlation between the proportion of Salvadorans and percentage of population with a disability in the United States with a correlation coefficient (R) of -0.495 and weighted average of 10.9%. On average, for every 1% (one percent) increase in Salvadorans within a typical geography, there is a decrease of 0.10% in percentage of population with a disability.
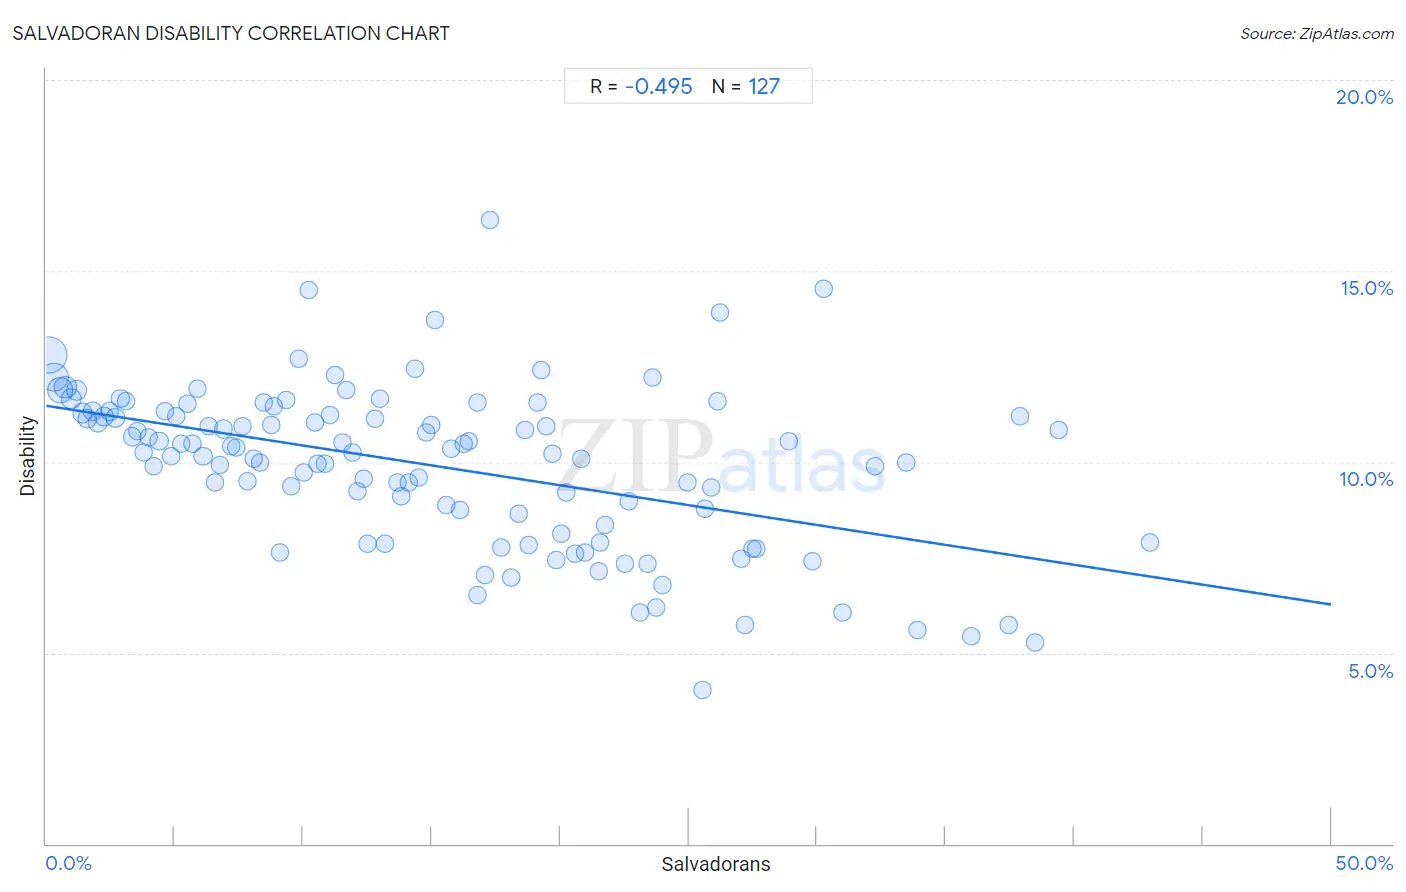
It is essential to understand that the correlation between the percentage of Salvadorans and percentage of population with a disability does not imply a direct cause-and-effect relationship. It remains uncertain whether the presence of Salvadorans influences an upward or downward trend in the level of percentage of population with a disability within an area, or if Salvadorans simply ended up residing in those areas with higher or lower levels of percentage of population with a disability due to other factors.
Demographics Similar to Salvadorans by Disability
In terms of disability, the demographic groups most similar to Salvadorans are Immigrants from South America (10.9%, a difference of 0.030%), Immigrants from Colombia (10.9%, a difference of 0.12%), Zimbabwean (10.9%, a difference of 0.22%), Immigrants from Lithuania (10.9%, a difference of 0.24%), and Immigrants from Bulgaria (10.9%, a difference of 0.27%).
| Demographics | Rating | Rank | Disability |
| Immigrants from Saudi Arabia | 99.9 /100 | #50 | Exceptional 10.9% |
| Peruvians | 99.8 /100 | #51 | Exceptional 10.9% |
| South Americans | 99.8 /100 | #52 | Exceptional 10.9% |
| Immigrants from Spain | 99.8 /100 | #53 | Exceptional 10.9% |
| Jordanians | 99.8 /100 | #54 | Exceptional 10.9% |
| Immigrants from El Salvador | 99.8 /100 | #55 | Exceptional 10.9% |
| Immigrants from Lithuania | 99.8 /100 | #56 | Exceptional 10.9% |
| Salvadorans | 99.8 /100 | #57 | Exceptional 10.9% |
| Immigrants from South America | 99.8 /100 | #58 | Exceptional 10.9% |
| Immigrants from Colombia | 99.7 /100 | #59 | Exceptional 10.9% |
| Zimbabweans | 99.7 /100 | #60 | Exceptional 10.9% |
| Immigrants from Bulgaria | 99.7 /100 | #61 | Exceptional 10.9% |
| Immigrants from Northern Africa | 99.7 /100 | #62 | Exceptional 10.9% |
| Immigrants from Eritrea | 99.7 /100 | #63 | Exceptional 11.0% |
| Immigrants from Sweden | 99.6 /100 | #64 | Exceptional 11.0% |
Salvadoran Disability Correlation Summary
| Measurement | Salvadoran Data | Disability Data |
| Minimum | 0.098% | 4.0% |
| Maximum | 42.9% | 16.3% |
| Range | 42.8% | 12.3% |
| Mean | 15.0% | 9.9% |
| Median | 13.8% | 10.3% |
| Interquartile 25% (IQ1) | 6.8% | 8.3% |
| Interquartile 75% (IQ3) | 21.6% | 11.3% |
| Interquartile Range (IQR) | 14.8% | 3.0% |
| Standard Deviation (Sample) | 10.1% | 2.1% |
| Standard Deviation (Population) | 10.0% | 2.1% |
Correlation Details
| Salvadoran Percentile | Sample Size | Disability |
[ 0.0% - 0.5% ] 0.098% | 130,288,132 | 12.8% |
[ 0.0% - 0.5% ] 0.31% | 74,439,054 | 12.2% |
[ 0.5% - 1.0% ] 0.54% | 48,872,280 | 11.9% |
[ 0.5% - 1.0% ] 0.74% | 29,195,996 | 12.0% |
[ 0.5% - 1.0% ] 0.97% | 17,203,948 | 11.6% |
[ 1.0% - 1.5% ] 1.17% | 13,557,406 | 11.9% |
[ 1.0% - 1.5% ] 1.40% | 10,491,699 | 11.3% |
[ 1.5% - 2.0% ] 1.61% | 10,314,351 | 11.1% |
[ 1.5% - 2.0% ] 1.82% | 8,164,439 | 11.3% |
[ 2.0% - 2.5% ] 2.01% | 6,008,421 | 11.0% |
[ 2.0% - 2.5% ] 2.24% | 4,571,889 | 11.2% |
[ 2.0% - 2.5% ] 2.48% | 4,346,955 | 11.3% |
[ 2.5% - 3.0% ] 2.68% | 4,078,800 | 11.2% |
[ 2.5% - 3.0% ] 2.89% | 2,624,807 | 11.7% |
[ 3.0% - 3.5% ] 3.12% | 2,750,979 | 11.6% |
[ 3.0% - 3.5% ] 3.34% | 2,122,248 | 10.7% |
[ 3.5% - 4.0% ] 3.56% | 1,938,420 | 10.8% |
[ 3.5% - 4.0% ] 3.78% | 1,677,179 | 10.2% |
[ 3.5% - 4.0% ] 3.99% | 1,294,450 | 10.6% |
[ 4.0% - 4.5% ] 4.19% | 1,061,385 | 9.9% |
[ 4.0% - 4.5% ] 4.39% | 3,059,360 | 10.5% |
[ 4.5% - 5.0% ] 4.62% | 895,536 | 11.3% |
[ 4.5% - 5.0% ] 4.85% | 929,141 | 10.1% |
[ 5.0% - 5.5% ] 5.05% | 641,858 | 11.2% |
[ 5.0% - 5.5% ] 5.26% | 899,252 | 10.5% |
[ 5.0% - 5.5% ] 5.50% | 876,625 | 11.5% |
[ 5.5% - 6.0% ] 5.68% | 540,729 | 10.5% |
[ 5.5% - 6.0% ] 5.89% | 425,791 | 11.9% |
[ 6.0% - 6.5% ] 6.10% | 705,847 | 10.1% |
[ 6.0% - 6.5% ] 6.32% | 504,684 | 10.9% |
[ 6.5% - 7.0% ] 6.55% | 588,446 | 9.5% |
[ 6.5% - 7.0% ] 6.77% | 446,667 | 9.9% |
[ 6.5% - 7.0% ] 6.89% | 4,234,353 | 10.9% |
[ 7.0% - 7.5% ] 7.18% | 410,446 | 10.4% |
[ 7.0% - 7.5% ] 7.40% | 204,611 | 10.4% |
[ 7.5% - 8.0% ] 7.62% | 385,004 | 10.9% |
[ 7.5% - 8.0% ] 7.83% | 449,125 | 9.5% |
[ 8.0% - 8.5% ] 8.07% | 533,342 | 10.1% |
[ 8.0% - 8.5% ] 8.32% | 111,922 | 10.0% |
[ 8.0% - 8.5% ] 8.45% | 474,844 | 11.6% |
[ 8.5% - 9.0% ] 8.76% | 278,674 | 11.0% |
[ 8.5% - 9.0% ] 8.85% | 91,083 | 11.4% |
[ 9.0% - 9.5% ] 9.11% | 460,232 | 7.6% |
[ 9.0% - 9.5% ] 9.35% | 326,192 | 11.6% |
[ 9.5% - 10.0% ] 9.54% | 173,122 | 9.4% |
[ 9.5% - 10.0% ] 9.84% | 35,556 | 12.7% |
[ 10.0% - 10.5% ] 10.03% | 248,031 | 9.7% |
[ 10.0% - 10.5% ] 10.20% | 101,876 | 14.5% |
[ 10.0% - 10.5% ] 10.45% | 101,006 | 11.0% |
[ 10.5% - 11.0% ] 10.57% | 171,371 | 9.9% |
[ 10.5% - 11.0% ] 10.83% | 148,589 | 10.0% |
[ 11.0% - 11.5% ] 11.06% | 253,808 | 11.2% |
[ 11.0% - 11.5% ] 11.26% | 104,852 | 12.3% |
[ 11.5% - 12.0% ] 11.51% | 65,190 | 10.5% |
[ 11.5% - 12.0% ] 11.69% | 170,308 | 11.9% |
[ 11.5% - 12.0% ] 11.91% | 224,804 | 10.3% |
[ 12.0% - 12.5% ] 12.13% | 89,488 | 9.2% |
[ 12.0% - 12.5% ] 12.37% | 236,936 | 9.6% |
[ 12.5% - 13.0% ] 12.51% | 54,358 | 7.8% |
[ 12.5% - 13.0% ] 12.81% | 65,355 | 11.1% |
[ 12.5% - 13.0% ] 13.00% | 152,703 | 11.6% |
[ 13.0% - 13.5% ] 13.19% | 108,529 | 7.8% |
[ 13.5% - 14.0% ] 13.66% | 130,830 | 9.4% |
[ 13.5% - 14.0% ] 13.84% | 25,613 | 9.1% |
[ 14.0% - 14.5% ] 14.11% | 114,309 | 9.4% |
[ 14.0% - 14.5% ] 14.33% | 134,582 | 12.5% |
[ 14.5% - 15.0% ] 14.51% | 140,862 | 9.6% |
[ 14.5% - 15.0% ] 14.77% | 150,964 | 10.8% |
[ 14.5% - 15.0% ] 14.99% | 147,047 | 11.0% |
[ 15.0% - 15.5% ] 15.13% | 1,355 | 13.7% |
[ 15.5% - 16.0% ] 15.57% | 88,968 | 8.9% |
[ 15.5% - 16.0% ] 15.77% | 50,114 | 10.3% |
[ 16.0% - 16.5% ] 16.09% | 56,628 | 8.7% |
[ 16.0% - 16.5% ] 16.23% | 144,532 | 10.5% |
[ 16.0% - 16.5% ] 16.43% | 45,208 | 10.5% |
[ 16.5% - 17.0% ] 16.76% | 57,711 | 11.5% |
[ 16.5% - 17.0% ] 16.78% | 6,453 | 6.5% |
[ 17.0% - 17.5% ] 17.09% | 32,271 | 7.1% |
[ 17.0% - 17.5% ] 17.29% | 2,719 | 16.3% |
[ 17.5% - 18.0% ] 17.71% | 67,229 | 7.8% |
[ 18.0% - 18.5% ] 18.11% | 55,960 | 7.0% |
[ 18.0% - 18.5% ] 18.39% | 63,751 | 8.7% |
[ 18.5% - 19.0% ] 18.62% | 18,346 | 10.8% |
[ 18.5% - 19.0% ] 18.75% | 63,975 | 7.8% |
[ 19.0% - 19.5% ] 19.12% | 17,123 | 11.6% |
[ 19.0% - 19.5% ] 19.27% | 38,524 | 12.4% |
[ 19.0% - 19.5% ] 19.47% | 7,657 | 10.9% |
[ 19.5% - 20.0% ] 19.69% | 83,947 | 10.2% |
[ 19.5% - 20.0% ] 19.87% | 100,019 | 7.4% |
[ 20.0% - 20.5% ] 20.03% | 56,319 | 8.1% |
[ 20.0% - 20.5% ] 20.25% | 33,927 | 9.2% |
[ 20.5% - 21.0% ] 20.60% | 61,783 | 7.6% |
[ 20.5% - 21.0% ] 20.82% | 51,837 | 10.1% |
[ 20.5% - 21.0% ] 20.98% | 53,308 | 7.6% |
[ 21.0% - 21.5% ] 21.48% | 58,557 | 7.1% |
[ 21.5% - 22.0% ] 21.56% | 19,289 | 7.9% |
[ 21.5% - 22.0% ] 21.74% | 28,660 | 8.3% |
[ 22.5% - 23.0% ] 22.52% | 14,470 | 7.3% |
[ 22.5% - 23.0% ] 22.65% | 34,625 | 9.0% |
[ 23.0% - 23.5% ] 23.12% | 19,102 | 6.1% |
[ 23.0% - 23.5% ] 23.38% | 53,870 | 7.3% |
[ 23.5% - 24.0% ] 23.60% | 19,704 | 12.2% |
[ 23.5% - 24.0% ] 23.74% | 19,233 | 6.2% |
[ 23.5% - 24.0% ] 23.95% | 27,886 | 6.8% |
[ 24.5% - 25.0% ] 24.97% | 921 | 9.4% |
[ 25.5% - 26.0% ] 25.55% | 21,778 | 4.0% |
[ 25.5% - 26.0% ] 25.64% | 35,336 | 8.8% |
[ 25.5% - 26.0% ] 25.88% | 167,043 | 9.3% |
[ 26.0% - 26.5% ] 26.12% | 82,627 | 11.6% |
[ 26.0% - 26.5% ] 26.22% | 39,875 | 13.9% |
[ 27.0% - 27.5% ] 27.05% | 3,782 | 7.5% |
[ 27.0% - 27.5% ] 27.19% | 22,276 | 5.7% |
[ 27.0% - 27.5% ] 27.47% | 22,966 | 7.7% |
[ 27.5% - 28.0% ] 27.64% | 4,617 | 7.7% |
[ 28.5% - 29.0% ] 28.89% | 8,629 | 10.5% |
[ 29.5% - 30.0% ] 29.79% | 10,563 | 7.4% |
[ 30.0% - 30.5% ] 30.25% | 10,469 | 14.5% |
[ 31.0% - 31.5% ] 31.00% | 101,422 | 6.0% |
[ 32.0% - 32.5% ] 32.26% | 1,516 | 9.9% |
[ 33.0% - 33.5% ] 33.45% | 3,312 | 10.0% |
[ 33.5% - 34.0% ] 33.91% | 14,162 | 5.6% |
[ 35.5% - 36.0% ] 35.98% | 1,751 | 5.4% |
[ 37.0% - 37.5% ] 37.43% | 12,603 | 5.7% |
[ 37.5% - 38.0% ] 37.91% | 2,118 | 11.2% |
[ 38.0% - 38.5% ] 38.45% | 684 | 5.3% |
[ 39.0% - 39.5% ] 39.40% | 1,764 | 10.8% |
[ 42.5% - 43.0% ] 42.92% | 212 | 7.9% |