Salvadoran Wage/Income Gap
COMPARE
Salvadoran
Select to Compare
Wage/Income Gap
Salvadoran Wage/Income Gap
23.0%
WAGE/INCOME GAP
99.9/ 100
METRIC RATING
80th/ 347
METRIC RANK
Salvadoran Wage/Income Gap Correlation Chart
The statistical analysis conducted on geographies consisting of 398,802,169 people shows no correlation between the proportion of Salvadorans and wage/income gap percentage in the United States with a correlation coefficient (R) of 0.039 and weighted average of 23.0%. On average, for every 1% (one percent) increase in Salvadorans within a typical geography, there is an increase of 0.033% in wage/income gap percentage.
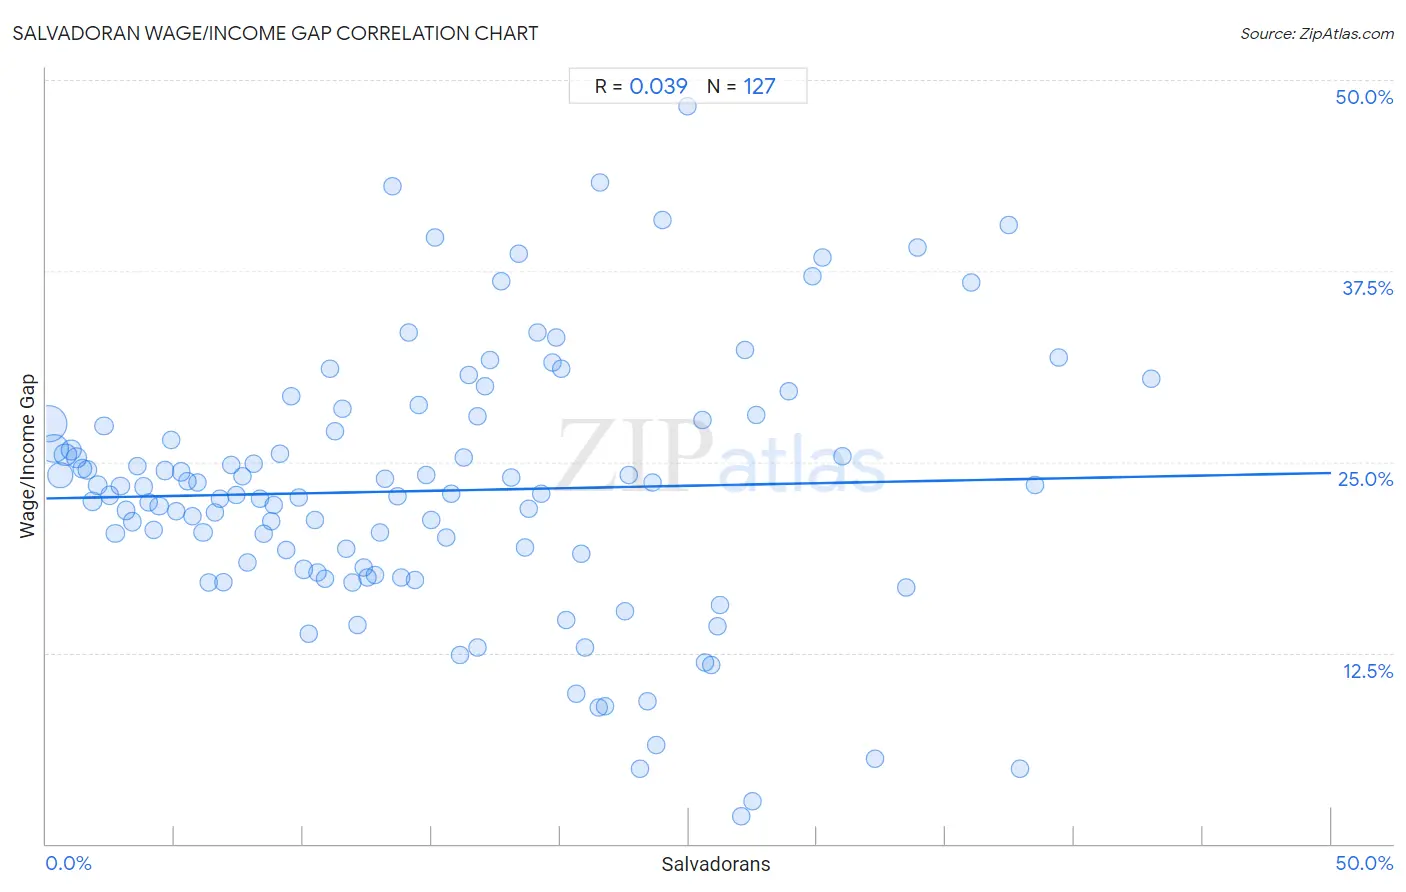
It is essential to understand that the correlation between the percentage of Salvadorans and wage/income gap percentage does not imply a direct cause-and-effect relationship. It remains uncertain whether the presence of Salvadorans influences an upward or downward trend in the level of wage/income gap percentage within an area, or if Salvadorans simply ended up residing in those areas with higher or lower levels of wage/income gap percentage due to other factors.
Demographics Similar to Salvadorans by Wage/Income Gap
In terms of wage/income gap, the demographic groups most similar to Salvadorans are Immigrants from Nicaragua (23.0%, a difference of 0.070%), Nigerian (23.0%, a difference of 0.15%), African (22.9%, a difference of 0.26%), Ecuadorian (22.9%, a difference of 0.39%), and Fijian (22.9%, a difference of 0.41%).
| Demographics | Rating | Rank | Wage/Income Gap |
| Immigrants from Eastern Africa | 99.9 /100 | #73 | Exceptional 22.8% |
| Immigrants from Burma/Myanmar | 99.9 /100 | #74 | Exceptional 22.8% |
| Fijians | 99.9 /100 | #75 | Exceptional 22.9% |
| Ecuadorians | 99.9 /100 | #76 | Exceptional 22.9% |
| Africans | 99.9 /100 | #77 | Exceptional 22.9% |
| Nigerians | 99.9 /100 | #78 | Exceptional 23.0% |
| Immigrants from Nicaragua | 99.9 /100 | #79 | Exceptional 23.0% |
| Salvadorans | 99.9 /100 | #80 | Exceptional 23.0% |
| Bermudans | 99.8 /100 | #81 | Exceptional 23.1% |
| Central Americans | 99.8 /100 | #82 | Exceptional 23.1% |
| Immigrants from Africa | 99.8 /100 | #83 | Exceptional 23.2% |
| Cubans | 99.7 /100 | #84 | Exceptional 23.3% |
| Immigrants from Cambodia | 99.7 /100 | #85 | Exceptional 23.3% |
| Cheyenne | 99.7 /100 | #86 | Exceptional 23.3% |
| Yuman | 99.7 /100 | #87 | Exceptional 23.3% |
Salvadoran Wage/Income Gap Correlation Summary
| Measurement | Salvadoran Data | Wage/Income Gap Data |
| Minimum | 0.098% | 1.8% |
| Maximum | 43.0% | 48.2% |
| Range | 42.9% | 46.5% |
| Mean | 15.0% | 23.1% |
| Median | 13.7% | 22.9% |
| Interquartile 25% (IQ1) | 6.8% | 18.0% |
| Interquartile 75% (IQ3) | 21.6% | 27.5% |
| Interquartile Range (IQR) | 14.8% | 9.5% |
| Standard Deviation (Sample) | 10.1% | 8.6% |
| Standard Deviation (Population) | 10.0% | 8.6% |
Correlation Details
| Salvadoran Percentile | Sample Size | Wage/Income Gap |
[ 0.0% - 0.5% ] 0.098% | 130,267,919 | 27.5% |
[ 0.0% - 0.5% ] 0.31% | 74,436,205 | 25.9% |
[ 0.5% - 1.0% ] 0.54% | 48,849,460 | 24.1% |
[ 0.5% - 1.0% ] 0.74% | 29,172,830 | 25.5% |
[ 0.5% - 1.0% ] 0.97% | 17,200,455 | 25.8% |
[ 1.0% - 1.5% ] 1.17% | 13,553,119 | 25.2% |
[ 1.0% - 1.5% ] 1.40% | 10,491,847 | 24.5% |
[ 1.5% - 2.0% ] 1.61% | 10,309,116 | 24.5% |
[ 1.5% - 2.0% ] 1.82% | 8,156,381 | 22.4% |
[ 2.0% - 2.5% ] 2.01% | 6,011,602 | 23.4% |
[ 2.0% - 2.5% ] 2.24% | 4,567,016 | 27.4% |
[ 2.0% - 2.5% ] 2.48% | 4,346,408 | 22.8% |
[ 2.5% - 3.0% ] 2.68% | 4,076,560 | 20.3% |
[ 2.5% - 3.0% ] 2.89% | 2,621,546 | 23.4% |
[ 3.0% - 3.5% ] 3.12% | 2,750,589 | 21.8% |
[ 3.0% - 3.5% ] 3.34% | 2,119,167 | 21.1% |
[ 3.5% - 4.0% ] 3.56% | 1,931,540 | 24.7% |
[ 3.5% - 4.0% ] 3.78% | 1,676,440 | 23.4% |
[ 3.5% - 4.0% ] 3.99% | 1,292,345 | 22.3% |
[ 4.0% - 4.5% ] 4.19% | 1,058,888 | 20.6% |
[ 4.0% - 4.5% ] 4.39% | 3,058,666 | 22.1% |
[ 4.5% - 5.0% ] 4.62% | 894,936 | 24.4% |
[ 4.5% - 5.0% ] 4.85% | 928,159 | 26.5% |
[ 5.0% - 5.5% ] 5.05% | 640,582 | 21.7% |
[ 5.0% - 5.5% ] 5.26% | 897,934 | 24.3% |
[ 5.0% - 5.5% ] 5.50% | 874,247 | 23.7% |
[ 5.5% - 6.0% ] 5.68% | 540,729 | 21.5% |
[ 5.5% - 6.0% ] 5.89% | 425,791 | 23.6% |
[ 6.0% - 6.5% ] 6.10% | 705,179 | 20.4% |
[ 6.0% - 6.5% ] 6.32% | 504,495 | 17.1% |
[ 6.5% - 7.0% ] 6.55% | 587,813 | 21.7% |
[ 6.5% - 7.0% ] 6.77% | 446,267 | 22.6% |
[ 6.5% - 7.0% ] 6.89% | 4,233,012 | 17.1% |
[ 7.0% - 7.5% ] 7.18% | 409,427 | 24.8% |
[ 7.0% - 7.5% ] 7.40% | 204,611 | 22.8% |
[ 7.5% - 8.0% ] 7.62% | 384,834 | 24.0% |
[ 7.5% - 8.0% ] 7.83% | 448,757 | 18.4% |
[ 8.0% - 8.5% ] 8.07% | 530,631 | 24.8% |
[ 8.0% - 8.5% ] 8.32% | 112,674 | 22.6% |
[ 8.0% - 8.5% ] 8.45% | 474,844 | 20.3% |
[ 8.5% - 9.0% ] 8.76% | 281,109 | 21.1% |
[ 8.5% - 9.0% ] 8.85% | 90,983 | 22.2% |
[ 9.0% - 9.5% ] 9.11% | 460,232 | 25.5% |
[ 9.0% - 9.5% ] 9.35% | 323,079 | 19.2% |
[ 9.5% - 10.0% ] 9.54% | 172,831 | 29.3% |
[ 9.5% - 10.0% ] 9.84% | 35,279 | 22.6% |
[ 10.0% - 10.5% ] 10.03% | 248,031 | 18.0% |
[ 10.0% - 10.5% ] 10.20% | 101,876 | 13.8% |
[ 10.0% - 10.5% ] 10.46% | 99,721 | 21.2% |
[ 10.5% - 11.0% ] 10.57% | 171,371 | 17.8% |
[ 10.5% - 11.0% ] 10.83% | 148,515 | 17.3% |
[ 11.0% - 11.5% ] 11.06% | 253,221 | 31.1% |
[ 11.0% - 11.5% ] 11.26% | 104,852 | 27.0% |
[ 11.5% - 12.0% ] 11.51% | 65,103 | 28.5% |
[ 11.5% - 12.0% ] 11.69% | 170,308 | 19.3% |
[ 11.5% - 12.0% ] 11.91% | 222,500 | 17.1% |
[ 12.0% - 12.5% ] 12.13% | 89,488 | 14.3% |
[ 12.0% - 12.5% ] 12.37% | 236,936 | 18.1% |
[ 12.5% - 13.0% ] 12.51% | 54,358 | 17.4% |
[ 12.5% - 13.0% ] 12.81% | 65,355 | 17.6% |
[ 12.5% - 13.0% ] 13.00% | 152,703 | 20.4% |
[ 13.0% - 13.5% ] 13.19% | 108,529 | 23.9% |
[ 13.0% - 13.5% ] 13.48% | 2,626 | 43.0% |
[ 13.5% - 14.0% ] 13.66% | 130,830 | 22.8% |
[ 13.5% - 14.0% ] 13.84% | 25,613 | 17.5% |
[ 14.0% - 14.5% ] 14.11% | 114,309 | 33.5% |
[ 14.0% - 14.5% ] 14.33% | 132,644 | 17.3% |
[ 14.5% - 15.0% ] 14.51% | 140,862 | 28.7% |
[ 14.5% - 15.0% ] 14.77% | 150,447 | 24.1% |
[ 14.5% - 15.0% ] 14.99% | 147,047 | 21.2% |
[ 15.0% - 15.5% ] 15.12% | 1,243 | 39.7% |
[ 15.5% - 16.0% ] 15.57% | 88,776 | 20.1% |
[ 15.5% - 16.0% ] 15.77% | 49,458 | 22.9% |
[ 16.0% - 16.5% ] 16.09% | 56,628 | 12.3% |
[ 16.0% - 16.5% ] 16.23% | 144,532 | 25.3% |
[ 16.0% - 16.5% ] 16.43% | 45,208 | 30.7% |
[ 16.5% - 17.0% ] 16.76% | 57,182 | 12.8% |
[ 16.5% - 17.0% ] 16.78% | 6,453 | 28.0% |
[ 17.0% - 17.5% ] 17.09% | 32,271 | 30.0% |
[ 17.0% - 17.5% ] 17.29% | 2,719 | 31.7% |
[ 17.5% - 18.0% ] 17.71% | 67,229 | 36.8% |
[ 18.0% - 18.5% ] 18.11% | 55,960 | 24.0% |
[ 18.0% - 18.5% ] 18.39% | 63,648 | 38.6% |
[ 18.5% - 19.0% ] 18.62% | 18,346 | 19.4% |
[ 18.5% - 19.0% ] 18.75% | 63,975 | 21.9% |
[ 19.0% - 19.5% ] 19.12% | 17,123 | 33.5% |
[ 19.0% - 19.5% ] 19.27% | 38,524 | 22.9% |
[ 19.5% - 20.0% ] 19.69% | 83,947 | 31.5% |
[ 19.5% - 20.0% ] 19.87% | 100,019 | 33.1% |
[ 20.0% - 20.5% ] 20.03% | 56,319 | 31.1% |
[ 20.0% - 20.5% ] 20.25% | 33,927 | 14.7% |
[ 20.5% - 21.0% ] 20.60% | 60,668 | 9.8% |
[ 20.5% - 21.0% ] 20.82% | 51,837 | 19.0% |
[ 20.5% - 21.0% ] 20.98% | 53,308 | 12.8% |
[ 21.0% - 21.5% ] 21.48% | 58,557 | 8.9% |
[ 21.5% - 22.0% ] 21.56% | 19,289 | 43.3% |
[ 21.5% - 22.0% ] 21.74% | 28,660 | 9.0% |
[ 22.5% - 23.0% ] 22.52% | 14,470 | 15.2% |
[ 22.5% - 23.0% ] 22.65% | 34,625 | 24.2% |
[ 23.0% - 23.5% ] 23.12% | 19,102 | 4.9% |
[ 23.0% - 23.5% ] 23.38% | 53,349 | 9.3% |
[ 23.5% - 24.0% ] 23.60% | 19,704 | 23.6% |
[ 23.5% - 24.0% ] 23.74% | 19,233 | 6.5% |
[ 23.5% - 24.0% ] 23.95% | 27,886 | 40.8% |
[ 24.5% - 25.0% ] 24.97% | 757 | 48.2% |
[ 25.5% - 26.0% ] 25.55% | 21,778 | 27.8% |
[ 25.5% - 26.0% ] 25.64% | 35,336 | 11.8% |
[ 25.5% - 26.0% ] 25.88% | 167,043 | 11.7% |
[ 26.0% - 26.5% ] 26.12% | 82,627 | 14.3% |
[ 26.0% - 26.5% ] 26.22% | 39,875 | 15.6% |
[ 27.0% - 27.5% ] 27.05% | 3,782 | 1.8% |
[ 27.0% - 27.5% ] 27.19% | 22,276 | 32.3% |
[ 27.0% - 27.5% ] 27.47% | 22,966 | 2.8% |
[ 27.5% - 28.0% ] 27.64% | 4,617 | 28.1% |
[ 28.5% - 29.0% ] 28.89% | 8,629 | 29.6% |
[ 29.5% - 30.0% ] 29.79% | 10,563 | 37.1% |
[ 30.0% - 30.5% ] 30.20% | 4,520 | 38.4% |
[ 31.0% - 31.5% ] 31.00% | 101,422 | 25.4% |
[ 32.0% - 32.5% ] 32.26% | 1,516 | 5.5% |
[ 33.0% - 33.5% ] 33.45% | 3,312 | 16.8% |
[ 33.5% - 34.0% ] 33.91% | 14,162 | 39.0% |
[ 35.5% - 36.0% ] 35.98% | 1,751 | 36.7% |
[ 37.0% - 37.5% ] 37.43% | 12,603 | 40.5% |
[ 37.5% - 38.0% ] 37.91% | 2,118 | 4.9% |
[ 38.0% - 38.5% ] 38.45% | 684 | 23.5% |
[ 39.0% - 39.5% ] 39.40% | 1,764 | 31.8% |
[ 42.5% - 43.0% ] 42.98% | 114 | 30.5% |