Salvadoran Unemployment Among Women with Children Ages 6 to 17 years
COMPARE
Salvadoran
Select to Compare
Unemployment Among Women with Children Ages 6 to 17 years
Salvadoran Unemployment Among Women with Children Ages 6 to 17 years
9.2%
UNEMPLOYMENT | WOMEN W/ CHILDREN 6 TO 17
10.7/ 100
METRIC RATING
209th/ 347
METRIC RANK
Salvadoran Unemployment Among Women with Children Ages 6 to 17 years Correlation Chart
The statistical analysis conducted on geographies consisting of 294,326,851 people shows a poor positive correlation between the proportion of Salvadorans and unemployment rate among women with children between the ages 6 and 17 in the United States with a correlation coefficient (R) of 0.136 and weighted average of 9.2%. On average, for every 1% (one percent) increase in Salvadorans within a typical geography, there is an increase of 0.11% in unemployment rate among women with children between the ages 6 and 17.
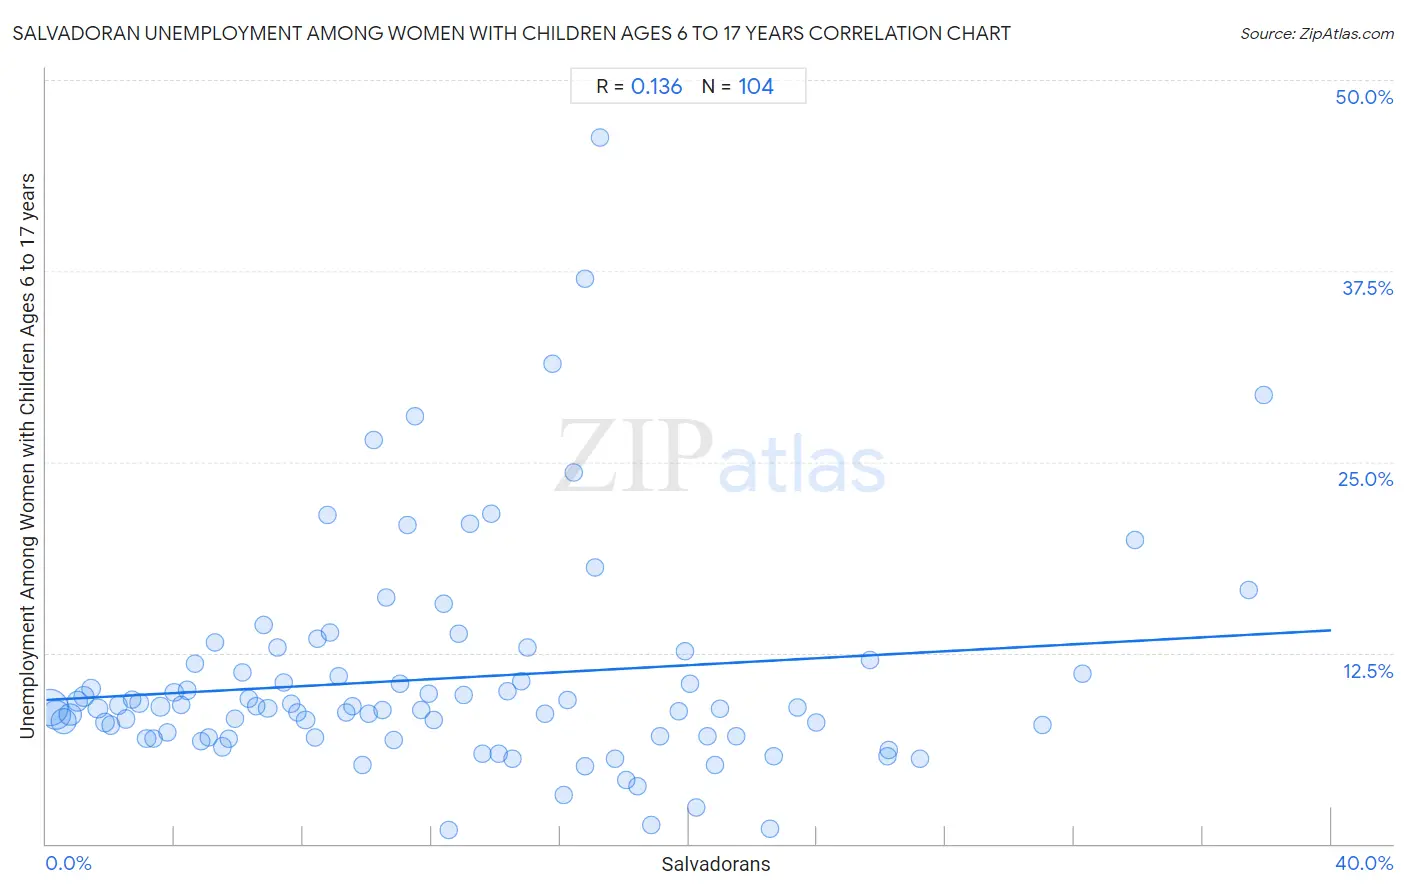
It is essential to understand that the correlation between the percentage of Salvadorans and unemployment rate among women with children between the ages 6 and 17 does not imply a direct cause-and-effect relationship. It remains uncertain whether the presence of Salvadorans influences an upward or downward trend in the level of unemployment rate among women with children between the ages 6 and 17 within an area, or if Salvadorans simply ended up residing in those areas with higher or lower levels of unemployment rate among women with children between the ages 6 and 17 due to other factors.
Demographics Similar to Salvadorans by Unemployment Among Women with Children Ages 6 to 17 years
In terms of unemployment among women with children ages 6 to 17 years, the demographic groups most similar to Salvadorans are Cuban (9.2%, a difference of 0.010%), Immigrants from Peru (9.2%, a difference of 0.010%), Finnish (9.2%, a difference of 0.090%), Immigrants from Cuba (9.2%, a difference of 0.14%), and Immigrants from North America (9.2%, a difference of 0.21%).
| Demographics | Rating | Rank | Unemployment Among Women with Children Ages 6 to 17 years |
| Immigrants from Middle Africa | 15.6 /100 | #202 | Poor 9.1% |
| Maltese | 15.3 /100 | #203 | Poor 9.1% |
| Immigrants from Canada | 15.3 /100 | #204 | Poor 9.1% |
| Immigrants from Western Europe | 14.1 /100 | #205 | Poor 9.1% |
| Immigrants from North America | 12.7 /100 | #206 | Poor 9.2% |
| Cubans | 10.9 /100 | #207 | Poor 9.2% |
| Immigrants from Peru | 10.8 /100 | #208 | Poor 9.2% |
| Salvadorans | 10.7 /100 | #209 | Poor 9.2% |
| Finns | 10.0 /100 | #210 | Tragic 9.2% |
| Immigrants from Cuba | 9.6 /100 | #211 | Tragic 9.2% |
| Peruvians | 9.0 /100 | #212 | Tragic 9.2% |
| Spaniards | 8.2 /100 | #213 | Tragic 9.2% |
| Iroquois | 7.5 /100 | #214 | Tragic 9.2% |
| Immigrants from Germany | 7.2 /100 | #215 | Tragic 9.2% |
| Immigrants from Uruguay | 7.2 /100 | #216 | Tragic 9.2% |
Salvadoran Unemployment Among Women with Children Ages 6 to 17 years Correlation Summary
| Measurement | Salvadoran Data | Unemployment Among Women with Children Ages 6 to 17 years Data |
| Minimum | 0.098% | 0.90% |
| Maximum | 37.9% | 46.2% |
| Range | 37.8% | 45.3% |
| Mean | 12.4% | 10.8% |
| Median | 11.1% | 8.9% |
| Interquartile 25% (IQ1) | 5.6% | 7.0% |
| Interquartile 75% (IQ3) | 17.5% | 11.5% |
| Interquartile Range (IQR) | 11.9% | 4.5% |
| Standard Deviation (Sample) | 8.6% | 7.2% |
| Standard Deviation (Population) | 8.5% | 7.1% |
Correlation Details
| Salvadoran Percentile | Sample Size | Unemployment Among Women with Children Ages 6 to 17 years |
[ 0.0% - 0.5% ] 0.098% | 90,580,349 | 8.9% |
[ 0.0% - 0.5% ] 0.31% | 55,543,581 | 8.4% |
[ 0.5% - 1.0% ] 0.54% | 37,130,223 | 8.0% |
[ 0.5% - 1.0% ] 0.74% | 22,137,276 | 8.4% |
[ 0.5% - 1.0% ] 0.97% | 12,193,222 | 9.3% |
[ 1.0% - 1.5% ] 1.17% | 10,116,252 | 9.6% |
[ 1.0% - 1.5% ] 1.40% | 7,337,393 | 10.2% |
[ 1.5% - 2.0% ] 1.61% | 8,281,430 | 8.8% |
[ 1.5% - 2.0% ] 1.82% | 6,371,189 | 8.0% |
[ 2.0% - 2.5% ] 2.01% | 4,696,082 | 7.7% |
[ 2.0% - 2.5% ] 2.25% | 3,250,534 | 9.1% |
[ 2.0% - 2.5% ] 2.48% | 3,347,317 | 8.2% |
[ 2.5% - 3.0% ] 2.68% | 3,550,194 | 9.4% |
[ 2.5% - 3.0% ] 2.89% | 1,978,666 | 9.2% |
[ 3.0% - 3.5% ] 3.12% | 2,163,622 | 6.9% |
[ 3.0% - 3.5% ] 3.34% | 1,670,424 | 6.9% |
[ 3.5% - 4.0% ] 3.56% | 1,562,188 | 9.0% |
[ 3.5% - 4.0% ] 3.78% | 1,047,440 | 7.3% |
[ 3.5% - 4.0% ] 3.99% | 923,414 | 9.9% |
[ 4.0% - 4.5% ] 4.19% | 770,362 | 9.1% |
[ 4.0% - 4.5% ] 4.39% | 2,750,242 | 10.0% |
[ 4.5% - 5.0% ] 4.63% | 659,935 | 11.8% |
[ 4.5% - 5.0% ] 4.84% | 730,188 | 6.7% |
[ 5.0% - 5.5% ] 5.05% | 452,124 | 6.9% |
[ 5.0% - 5.5% ] 5.26% | 528,978 | 13.2% |
[ 5.0% - 5.5% ] 5.49% | 705,959 | 6.3% |
[ 5.5% - 6.0% ] 5.68% | 466,842 | 6.9% |
[ 5.5% - 6.0% ] 5.89% | 292,414 | 8.2% |
[ 6.0% - 6.5% ] 6.09% | 481,184 | 11.2% |
[ 6.0% - 6.5% ] 6.31% | 395,607 | 9.5% |
[ 6.5% - 7.0% ] 6.55% | 476,193 | 9.0% |
[ 6.5% - 7.0% ] 6.78% | 339,523 | 14.3% |
[ 6.5% - 7.0% ] 6.89% | 4,117,327 | 8.9% |
[ 7.0% - 7.5% ] 7.18% | 374,005 | 12.8% |
[ 7.0% - 7.5% ] 7.41% | 186,269 | 10.5% |
[ 7.5% - 8.0% ] 7.63% | 310,808 | 9.2% |
[ 7.5% - 8.0% ] 7.81% | 374,654 | 8.6% |
[ 8.0% - 8.5% ] 8.07% | 461,293 | 8.1% |
[ 8.0% - 8.5% ] 8.35% | 60,208 | 7.0% |
[ 8.0% - 8.5% ] 8.44% | 419,468 | 13.4% |
[ 8.5% - 9.0% ] 8.76% | 246,143 | 21.5% |
[ 8.5% - 9.0% ] 8.84% | 84,345 | 13.8% |
[ 9.0% - 9.5% ] 9.11% | 447,616 | 11.0% |
[ 9.0% - 9.5% ] 9.33% | 237,489 | 8.6% |
[ 9.5% - 10.0% ] 9.54% | 155,074 | 9.0% |
[ 9.5% - 10.0% ] 9.86% | 20,273 | 5.1% |
[ 10.0% - 10.5% ] 10.03% | 177,340 | 8.5% |
[ 10.0% - 10.5% ] 10.20% | 70,786 | 26.4% |
[ 10.0% - 10.5% ] 10.46% | 94,795 | 8.7% |
[ 10.5% - 11.0% ] 10.57% | 102,390 | 16.1% |
[ 10.5% - 11.0% ] 10.83% | 148,515 | 6.8% |
[ 11.0% - 11.5% ] 11.03% | 197,480 | 10.5% |
[ 11.0% - 11.5% ] 11.26% | 76,349 | 20.9% |
[ 11.0% - 11.5% ] 11.49% | 29,870 | 28.0% |
[ 11.5% - 12.0% ] 11.69% | 167,741 | 8.8% |
[ 11.5% - 12.0% ] 11.91% | 206,259 | 9.8% |
[ 12.0% - 12.5% ] 12.07% | 45,278 | 8.1% |
[ 12.0% - 12.5% ] 12.37% | 170,084 | 15.7% |
[ 12.5% - 13.0% ] 12.51% | 54,358 | 0.90% |
[ 12.5% - 13.0% ] 12.84% | 46,311 | 13.8% |
[ 12.5% - 13.0% ] 12.99% | 142,623 | 9.8% |
[ 13.0% - 13.5% ] 13.19% | 79,773 | 21.0% |
[ 13.5% - 14.0% ] 13.60% | 54,262 | 5.9% |
[ 13.5% - 14.0% ] 13.87% | 9,761 | 21.6% |
[ 14.0% - 14.5% ] 14.08% | 86,177 | 5.9% |
[ 14.0% - 14.5% ] 14.36% | 98,990 | 10.0% |
[ 14.5% - 15.0% ] 14.51% | 140,862 | 5.6% |
[ 14.5% - 15.0% ] 14.78% | 146,990 | 10.6% |
[ 14.5% - 15.0% ] 14.99% | 146,584 | 12.8% |
[ 15.5% - 16.0% ] 15.53% | 9,141 | 8.5% |
[ 15.5% - 16.0% ] 15.77% | 48,651 | 31.4% |
[ 16.0% - 16.5% ] 16.09% | 56,628 | 3.2% |
[ 16.0% - 16.5% ] 16.23% | 142,992 | 9.4% |
[ 16.0% - 16.5% ] 16.41% | 1,243 | 24.3% |
[ 16.5% - 17.0% ] 16.76% | 49,898 | 5.1% |
[ 16.5% - 17.0% ] 16.76% | 5,697 | 37.0% |
[ 17.0% - 17.5% ] 17.06% | 25,324 | 18.1% |
[ 17.0% - 17.5% ] 17.24% | 1,833 | 46.2% |
[ 17.5% - 18.0% ] 17.71% | 67,229 | 5.5% |
[ 18.0% - 18.5% ] 18.06% | 35,594 | 4.1% |
[ 18.0% - 18.5% ] 18.39% | 63,648 | 3.8% |
[ 18.5% - 19.0% ] 18.84% | 20,851 | 1.2% |
[ 19.0% - 19.5% ] 19.12% | 17,123 | 7.0% |
[ 19.5% - 20.0% ] 19.69% | 66,720 | 8.7% |
[ 19.5% - 20.0% ] 19.87% | 97,824 | 12.6% |
[ 20.0% - 20.5% ] 20.03% | 56,319 | 10.5% |
[ 20.0% - 20.5% ] 20.25% | 32,191 | 2.4% |
[ 20.5% - 21.0% ] 20.60% | 60,668 | 7.0% |
[ 20.5% - 21.0% ] 20.82% | 51,837 | 5.1% |
[ 20.5% - 21.0% ] 20.98% | 53,308 | 8.8% |
[ 21.0% - 21.5% ] 21.48% | 58,557 | 7.0% |
[ 22.5% - 23.0% ] 22.53% | 13,299 | 1.0% |
[ 22.5% - 23.0% ] 22.65% | 34,625 | 5.7% |
[ 23.0% - 23.5% ] 23.38% | 52,775 | 8.9% |
[ 23.5% - 24.0% ] 23.95% | 27,886 | 7.9% |
[ 25.5% - 26.0% ] 25.64% | 35,336 | 12.0% |
[ 26.0% - 26.5% ] 26.20% | 46,108 | 5.8% |
[ 26.0% - 26.5% ] 26.22% | 39,875 | 6.1% |
[ 27.0% - 27.5% ] 27.18% | 18,080 | 5.6% |
[ 31.0% - 31.5% ] 31.00% | 86,295 | 7.8% |
[ 32.0% - 32.5% ] 32.26% | 1,516 | 11.1% |
[ 33.5% - 34.0% ] 33.91% | 14,162 | 19.9% |
[ 37.0% - 37.5% ] 37.43% | 12,603 | 16.6% |
[ 37.5% - 38.0% ] 37.91% | 2,118 | 29.4% |