Pakistani Married-Couple Family Poverty
COMPARE
Pakistani
Select to Compare
Married-Couple Family Poverty
Pakistani Married-Couple Family Poverty
4.7%
POVERTY | MARRIED-COUPLE FAMILIES
96.2/ 100
METRIC RATING
111th/ 347
METRIC RANK
Pakistani Married-Couple Family Poverty Correlation Chart
The statistical analysis conducted on geographies consisting of 333,416,483 people shows a substantial positive correlation between the proportion of Pakistanis and poverty level among married-couple families in the United States with a correlation coefficient (R) of 0.547 and weighted average of 4.7%. On average, for every 1% (one percent) increase in Pakistanis within a typical geography, there is an increase of 1.6% in poverty level among married-couple families.
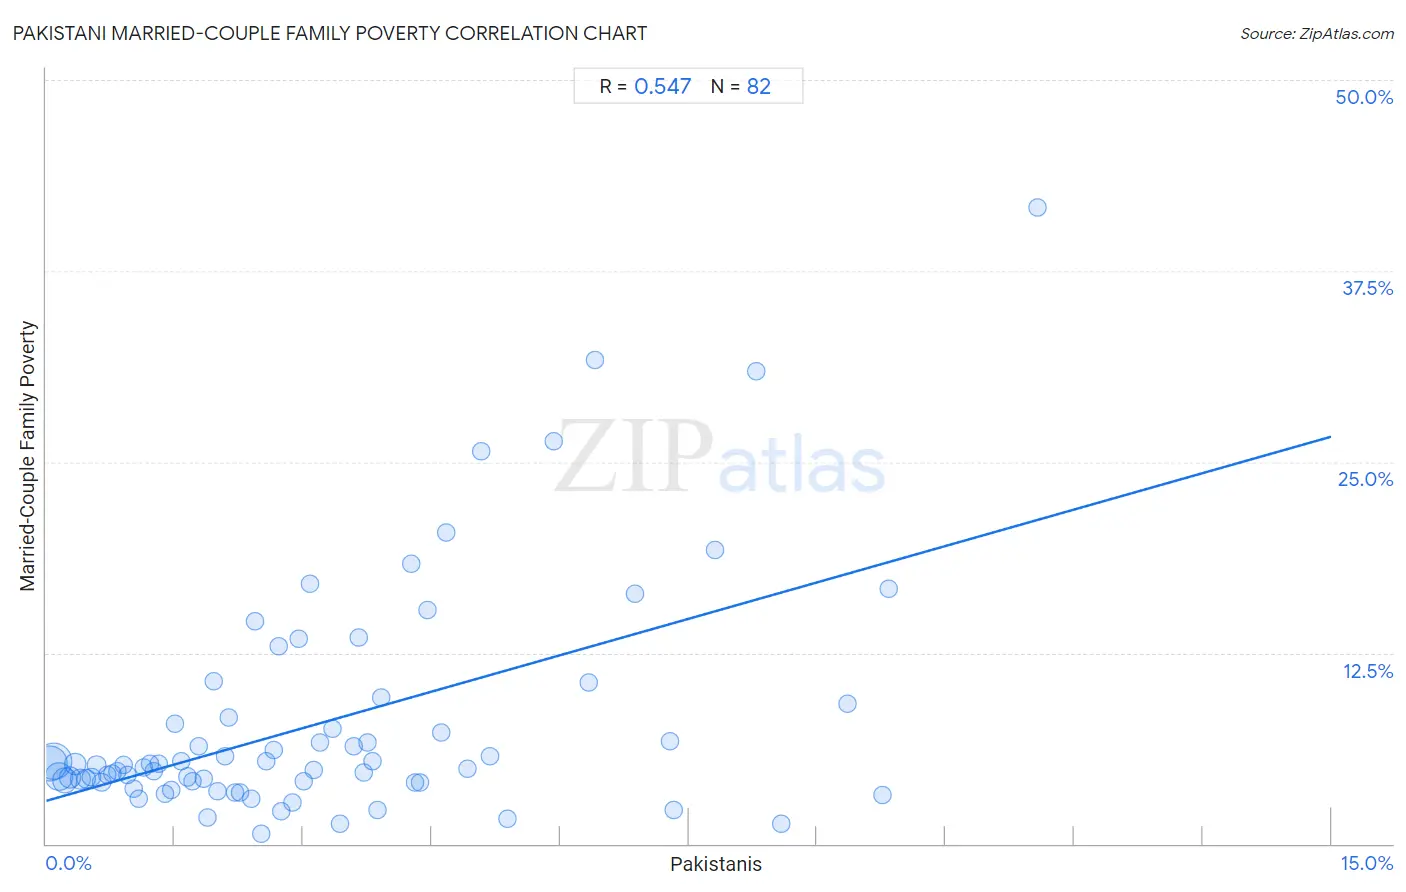
It is essential to understand that the correlation between the percentage of Pakistanis and poverty level among married-couple families does not imply a direct cause-and-effect relationship. It remains uncertain whether the presence of Pakistanis influences an upward or downward trend in the level of poverty level among married-couple families within an area, or if Pakistanis simply ended up residing in those areas with higher or lower levels of poverty level among married-couple families due to other factors.
Demographics Similar to Pakistanis by Married-Couple Family Poverty
In terms of married-couple family poverty, the demographic groups most similar to Pakistanis are Immigrants from Bolivia (4.7%, a difference of 0.040%), Tongan (4.7%, a difference of 0.18%), Immigrants from Hong Kong (4.7%, a difference of 0.20%), Immigrants from Nepal (4.7%, a difference of 0.25%), and Laotian (4.7%, a difference of 0.40%).
| Demographics | Rating | Rank | Married-Couple Family Poverty |
| Immigrants from Moldova | 97.1 /100 | #104 | Exceptional 4.7% |
| Aleuts | 97.0 /100 | #105 | Exceptional 4.7% |
| Immigrants from France | 96.9 /100 | #106 | Exceptional 4.7% |
| Immigrants from Germany | 96.8 /100 | #107 | Exceptional 4.7% |
| Laotians | 96.6 /100 | #108 | Exceptional 4.7% |
| Immigrants from Hong Kong | 96.4 /100 | #109 | Exceptional 4.7% |
| Immigrants from Bolivia | 96.2 /100 | #110 | Exceptional 4.7% |
| Pakistanis | 96.2 /100 | #111 | Exceptional 4.7% |
| Tongans | 95.9 /100 | #112 | Exceptional 4.7% |
| Immigrants from Nepal | 95.9 /100 | #113 | Exceptional 4.7% |
| Immigrants from Indonesia | 95.1 /100 | #114 | Exceptional 4.8% |
| Taiwanese | 94.8 /100 | #115 | Exceptional 4.8% |
| Celtics | 94.8 /100 | #116 | Exceptional 4.8% |
| Kenyans | 94.7 /100 | #117 | Exceptional 4.8% |
| Immigrants from Philippines | 94.6 /100 | #118 | Exceptional 4.8% |
Pakistani Married-Couple Family Poverty Correlation Summary
| Measurement | Pakistani Data | Married-Couple Family Poverty Data |
| Minimum | 0.034% | 0.63% |
| Maximum | 11.6% | 41.7% |
| Range | 11.5% | 41.0% |
| Mean | 3.2% | 7.9% |
| Median | 2.6% | 5.2% |
| Interquartile 25% (IQ1) | 1.3% | 4.0% |
| Interquartile 75% (IQ3) | 4.4% | 8.3% |
| Interquartile Range (IQR) | 3.1% | 4.3% |
| Standard Deviation (Sample) | 2.6% | 7.6% |
| Standard Deviation (Population) | 2.6% | 7.5% |
Correlation Details
| Pakistani Percentile | Sample Size | Married-Couple Family Poverty |
[ 0.0% - 0.5% ] 0.034% | 89,912,694 | 5.3% |
[ 0.0% - 0.5% ] 0.091% | 93,639,233 | 5.4% |
[ 0.0% - 0.5% ] 0.15% | 47,347,351 | 4.4% |
[ 0.0% - 0.5% ] 0.21% | 33,546,219 | 4.1% |
[ 0.0% - 0.5% ] 0.28% | 18,585,159 | 4.4% |
[ 0.0% - 0.5% ] 0.34% | 16,530,864 | 5.2% |
[ 0.0% - 0.5% ] 0.40% | 8,368,676 | 4.2% |
[ 0.0% - 0.5% ] 0.46% | 6,868,297 | 4.3% |
[ 0.5% - 1.0% ] 0.52% | 4,074,433 | 4.4% |
[ 0.5% - 1.0% ] 0.59% | 3,043,475 | 5.2% |
[ 0.5% - 1.0% ] 0.65% | 2,150,101 | 4.0% |
[ 0.5% - 1.0% ] 0.72% | 1,869,854 | 4.5% |
[ 0.5% - 1.0% ] 0.77% | 1,248,673 | 4.6% |
[ 0.5% - 1.0% ] 0.83% | 1,111,838 | 4.8% |
[ 0.5% - 1.0% ] 0.90% | 850,925 | 5.1% |
[ 0.5% - 1.0% ] 0.95% | 740,737 | 4.5% |
[ 1.0% - 1.5% ] 1.02% | 406,959 | 3.6% |
[ 1.0% - 1.5% ] 1.08% | 271,946 | 2.9% |
[ 1.0% - 1.5% ] 1.14% | 220,255 | 5.0% |
[ 1.0% - 1.5% ] 1.21% | 292,577 | 5.3% |
[ 1.0% - 1.5% ] 1.26% | 254,568 | 4.7% |
[ 1.0% - 1.5% ] 1.32% | 224,482 | 5.2% |
[ 1.0% - 1.5% ] 1.39% | 283,665 | 3.3% |
[ 1.0% - 1.5% ] 1.46% | 173,771 | 3.5% |
[ 1.5% - 2.0% ] 1.51% | 258,732 | 7.8% |
[ 1.5% - 2.0% ] 1.57% | 130,555 | 5.4% |
[ 1.5% - 2.0% ] 1.64% | 131,621 | 4.4% |
[ 1.5% - 2.0% ] 1.70% | 146,306 | 4.1% |
[ 1.5% - 2.0% ] 1.78% | 180,469 | 6.4% |
[ 1.5% - 2.0% ] 1.84% | 71,543 | 4.3% |
[ 1.5% - 2.0% ] 1.88% | 43,524 | 1.7% |
[ 1.5% - 2.0% ] 1.96% | 51,382 | 10.7% |
[ 2.0% - 2.5% ] 2.01% | 43,341 | 3.4% |
[ 2.0% - 2.5% ] 2.09% | 12,840 | 5.7% |
[ 2.0% - 2.5% ] 2.13% | 64,465 | 8.3% |
[ 2.0% - 2.5% ] 2.21% | 24,707 | 3.3% |
[ 2.0% - 2.5% ] 2.27% | 24,198 | 3.3% |
[ 2.0% - 2.5% ] 2.39% | 12,279 | 2.9% |
[ 2.0% - 2.5% ] 2.44% | 9,002 | 14.6% |
[ 2.5% - 3.0% ] 2.50% | 9,108 | 0.63% |
[ 2.5% - 3.0% ] 2.56% | 3,670 | 5.4% |
[ 2.5% - 3.0% ] 2.65% | 2,792 | 6.1% |
[ 2.5% - 3.0% ] 2.71% | 4,574 | 12.9% |
[ 2.5% - 3.0% ] 2.74% | 54,696 | 2.1% |
[ 2.5% - 3.0% ] 2.88% | 8,157 | 2.7% |
[ 2.5% - 3.0% ] 2.95% | 746 | 13.4% |
[ 3.0% - 3.5% ] 3.01% | 3,427 | 4.1% |
[ 3.0% - 3.5% ] 3.07% | 13,407 | 17.0% |
[ 3.0% - 3.5% ] 3.13% | 15,816 | 4.8% |
[ 3.0% - 3.5% ] 3.19% | 1,723 | 6.7% |
[ 3.0% - 3.5% ] 3.34% | 449 | 7.5% |
[ 3.0% - 3.5% ] 3.43% | 4,085 | 1.3% |
[ 3.5% - 4.0% ] 3.59% | 3,373 | 6.4% |
[ 3.5% - 4.0% ] 3.65% | 630 | 13.5% |
[ 3.5% - 4.0% ] 3.71% | 674 | 4.7% |
[ 3.5% - 4.0% ] 3.75% | 587 | 6.6% |
[ 3.5% - 4.0% ] 3.80% | 15,200 | 5.4% |
[ 3.5% - 4.0% ] 3.87% | 852 | 2.2% |
[ 3.5% - 4.0% ] 3.91% | 15,132 | 9.5% |
[ 4.0% - 4.5% ] 4.26% | 8,103 | 18.4% |
[ 4.0% - 4.5% ] 4.31% | 3,458 | 4.0% |
[ 4.0% - 4.5% ] 4.37% | 6,777 | 4.0% |
[ 4.0% - 4.5% ] 4.44% | 540 | 15.3% |
[ 4.5% - 5.0% ] 4.62% | 390 | 7.3% |
[ 4.5% - 5.0% ] 4.67% | 664 | 20.4% |
[ 4.5% - 5.0% ] 4.91% | 468 | 5.0% |
[ 5.0% - 5.5% ] 5.07% | 493 | 25.7% |
[ 5.0% - 5.5% ] 5.18% | 1,235 | 5.7% |
[ 5.0% - 5.5% ] 5.39% | 1,577 | 1.6% |
[ 5.5% - 6.0% ] 5.92% | 152 | 26.3% |
[ 6.0% - 6.5% ] 6.33% | 158 | 10.5% |
[ 6.0% - 6.5% ] 6.40% | 250 | 31.7% |
[ 6.5% - 7.0% ] 6.87% | 262 | 16.4% |
[ 7.0% - 7.5% ] 7.27% | 1,086 | 6.7% |
[ 7.0% - 7.5% ] 7.33% | 2,647 | 2.2% |
[ 7.5% - 8.0% ] 7.81% | 1,268 | 19.3% |
[ 8.0% - 8.5% ] 8.28% | 483 | 30.9% |
[ 8.5% - 9.0% ] 8.58% | 536 | 1.3% |
[ 9.0% - 9.5% ] 9.35% | 2,332 | 9.1% |
[ 9.5% - 10.0% ] 9.76% | 1,475 | 3.2% |
[ 9.5% - 10.0% ] 9.84% | 183 | 16.7% |
[ 11.5% - 12.0% ] 11.57% | 1,132 | 41.7% |