Pakistani Self-Care Disability
COMPARE
Pakistani
Select to Compare
Self-Care Disability
Pakistani Self-Care Disability
2.4%
SELF-CARE DISABILITY
71.4/ 100
METRIC RATING
155th/ 347
METRIC RANK
Pakistani Self-Care Disability Correlation Chart
The statistical analysis conducted on geographies consisting of 334,999,901 people shows a mild positive correlation between the proportion of Pakistanis and percentage of population with self-care disability in the United States with a correlation coefficient (R) of 0.351 and weighted average of 2.4%. On average, for every 1% (one percent) increase in Pakistanis within a typical geography, there is an increase of 0.21% in percentage of population with self-care disability.
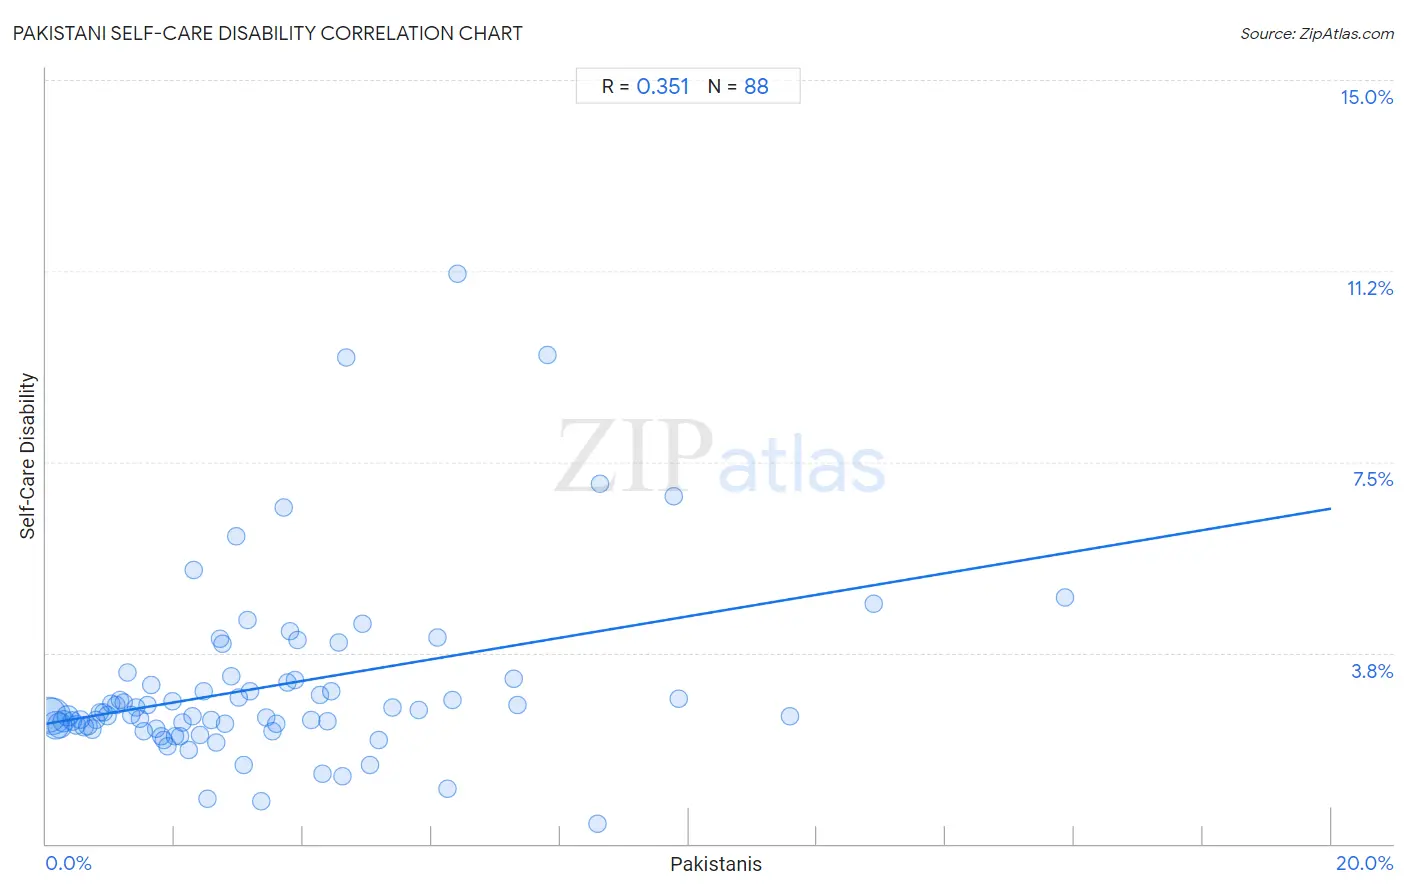
It is essential to understand that the correlation between the percentage of Pakistanis and percentage of population with self-care disability does not imply a direct cause-and-effect relationship. It remains uncertain whether the presence of Pakistanis influences an upward or downward trend in the level of percentage of population with self-care disability within an area, or if Pakistanis simply ended up residing in those areas with higher or lower levels of percentage of population with self-care disability due to other factors.
Demographics Similar to Pakistanis by Self-Care Disability
In terms of self-care disability, the demographic groups most similar to Pakistanis are Italian (2.4%, a difference of 0.050%), Nigerian (2.4%, a difference of 0.050%), Immigrants from Europe (2.4%, a difference of 0.11%), Immigrants from England (2.4%, a difference of 0.12%), and Tlingit-Haida (2.4%, a difference of 0.13%).
| Demographics | Rating | Rank | Self-Care Disability |
| Romanians | 75.8 /100 | #148 | Good 2.4% |
| Arabs | 75.7 /100 | #149 | Good 2.4% |
| Immigrants from Costa Rica | 75.1 /100 | #150 | Good 2.4% |
| Basques | 74.0 /100 | #151 | Good 2.4% |
| Tlingit-Haida | 73.5 /100 | #152 | Good 2.4% |
| Immigrants from England | 73.5 /100 | #153 | Good 2.4% |
| Italians | 72.2 /100 | #154 | Good 2.4% |
| Pakistanis | 71.4 /100 | #155 | Good 2.4% |
| Nigerians | 70.6 /100 | #156 | Good 2.4% |
| Immigrants from Europe | 69.6 /100 | #157 | Good 2.4% |
| Immigrants from Western Europe | 68.6 /100 | #158 | Good 2.4% |
| Immigrants from Italy | 68.5 /100 | #159 | Good 2.4% |
| Finns | 67.0 /100 | #160 | Good 2.4% |
| Lebanese | 66.5 /100 | #161 | Good 2.4% |
| Somalis | 63.7 /100 | #162 | Good 2.5% |
Pakistani Self-Care Disability Correlation Summary
| Measurement | Pakistani Data | Self-Care Disability Data |
| Minimum | 0.034% | 0.40% |
| Maximum | 15.9% | 11.2% |
| Range | 15.8% | 10.8% |
| Mean | 3.4% | 3.1% |
| Median | 2.7% | 2.5% |
| Interquartile 25% (IQ1) | 1.4% | 2.3% |
| Interquartile 75% (IQ3) | 4.5% | 3.2% |
| Interquartile Range (IQR) | 3.1% | 0.89% |
| Standard Deviation (Sample) | 3.0% | 1.8% |
| Standard Deviation (Population) | 3.0% | 1.8% |
Correlation Details
| Pakistani Percentile | Sample Size | Self-Care Disability |
[ 0.0% - 0.5% ] 0.034% | 90,040,853 | 2.5% |
[ 0.0% - 0.5% ] 0.091% | 93,713,076 | 2.5% |
[ 0.0% - 0.5% ] 0.15% | 47,620,916 | 2.3% |
[ 0.0% - 0.5% ] 0.21% | 33,655,898 | 2.3% |
[ 0.0% - 0.5% ] 0.28% | 18,757,666 | 2.4% |
[ 0.0% - 0.5% ] 0.34% | 16,630,499 | 2.5% |
[ 0.0% - 0.5% ] 0.40% | 8,471,022 | 2.4% |
[ 0.0% - 0.5% ] 0.46% | 6,984,722 | 2.3% |
[ 0.5% - 1.0% ] 0.52% | 4,124,450 | 2.4% |
[ 0.5% - 1.0% ] 0.59% | 3,078,622 | 2.3% |
[ 0.5% - 1.0% ] 0.65% | 2,240,746 | 2.3% |
[ 0.5% - 1.0% ] 0.72% | 1,905,760 | 2.2% |
[ 0.5% - 1.0% ] 0.77% | 1,314,627 | 2.4% |
[ 0.5% - 1.0% ] 0.83% | 1,133,756 | 2.6% |
[ 0.5% - 1.0% ] 0.90% | 859,528 | 2.6% |
[ 0.5% - 1.0% ] 0.95% | 748,652 | 2.5% |
[ 1.0% - 1.5% ] 1.02% | 423,433 | 2.7% |
[ 1.0% - 1.5% ] 1.08% | 292,618 | 2.7% |
[ 1.0% - 1.5% ] 1.14% | 230,129 | 2.8% |
[ 1.0% - 1.5% ] 1.21% | 301,229 | 2.8% |
[ 1.0% - 1.5% ] 1.26% | 258,124 | 3.4% |
[ 1.0% - 1.5% ] 1.32% | 235,940 | 2.5% |
[ 1.0% - 1.5% ] 1.39% | 284,249 | 2.7% |
[ 1.0% - 1.5% ] 1.46% | 182,540 | 2.5% |
[ 1.5% - 2.0% ] 1.51% | 260,747 | 2.2% |
[ 1.5% - 2.0% ] 1.57% | 137,156 | 2.7% |
[ 1.5% - 2.0% ] 1.64% | 145,850 | 3.1% |
[ 1.5% - 2.0% ] 1.70% | 151,933 | 2.3% |
[ 1.5% - 2.0% ] 1.78% | 184,954 | 2.1% |
[ 1.5% - 2.0% ] 1.83% | 73,652 | 2.0% |
[ 1.5% - 2.0% ] 1.89% | 54,729 | 1.9% |
[ 1.5% - 2.0% ] 1.96% | 52,852 | 2.8% |
[ 2.0% - 2.5% ] 2.01% | 52,397 | 2.1% |
[ 2.0% - 2.5% ] 2.08% | 16,454 | 2.1% |
[ 2.0% - 2.5% ] 2.13% | 64,465 | 2.4% |
[ 2.0% - 2.5% ] 2.21% | 24,707 | 1.8% |
[ 2.0% - 2.5% ] 2.27% | 25,953 | 2.5% |
[ 2.0% - 2.5% ] 2.30% | 304 | 5.4% |
[ 2.0% - 2.5% ] 2.39% | 14,274 | 2.1% |
[ 2.0% - 2.5% ] 2.45% | 10,378 | 3.0% |
[ 2.5% - 3.0% ] 2.50% | 8,831 | 0.89% |
[ 2.5% - 3.0% ] 2.56% | 15,140 | 2.4% |
[ 2.5% - 3.0% ] 2.64% | 6,359 | 2.0% |
[ 2.5% - 3.0% ] 2.70% | 5,768 | 4.0% |
[ 2.5% - 3.0% ] 2.74% | 58,031 | 3.9% |
[ 2.5% - 3.0% ] 2.79% | 502 | 2.4% |
[ 2.5% - 3.0% ] 2.88% | 11,457 | 3.3% |
[ 2.5% - 3.0% ] 2.95% | 746 | 6.0% |
[ 3.0% - 3.5% ] 3.00% | 3,828 | 2.9% |
[ 3.0% - 3.5% ] 3.07% | 17,053 | 1.5% |
[ 3.0% - 3.5% ] 3.13% | 15,816 | 4.4% |
[ 3.0% - 3.5% ] 3.18% | 3,113 | 3.0% |
[ 3.0% - 3.5% ] 3.34% | 1,916 | 0.83% |
[ 3.0% - 3.5% ] 3.42% | 3,417 | 2.5% |
[ 3.5% - 4.0% ] 3.51% | 1,452 | 2.2% |
[ 3.5% - 4.0% ] 3.59% | 3,373 | 2.4% |
[ 3.5% - 4.0% ] 3.69% | 1,002 | 6.6% |
[ 3.5% - 4.0% ] 3.75% | 587 | 3.2% |
[ 3.5% - 4.0% ] 3.80% | 15,200 | 4.2% |
[ 3.5% - 4.0% ] 3.87% | 1,033 | 3.2% |
[ 3.5% - 4.0% ] 3.91% | 16,277 | 4.0% |
[ 4.0% - 4.5% ] 4.13% | 1,478 | 2.4% |
[ 4.0% - 4.5% ] 4.25% | 9,756 | 2.9% |
[ 4.0% - 4.5% ] 4.31% | 4,503 | 1.4% |
[ 4.0% - 4.5% ] 4.37% | 7,757 | 2.4% |
[ 4.0% - 4.5% ] 4.44% | 540 | 3.0% |
[ 4.5% - 5.0% ] 4.55% | 2,243 | 3.9% |
[ 4.5% - 5.0% ] 4.62% | 390 | 1.3% |
[ 4.5% - 5.0% ] 4.67% | 664 | 9.5% |
[ 4.5% - 5.0% ] 4.91% | 468 | 4.3% |
[ 5.0% - 5.5% ] 5.03% | 3,120 | 1.5% |
[ 5.0% - 5.5% ] 5.18% | 1,235 | 2.0% |
[ 5.0% - 5.5% ] 5.39% | 1,577 | 2.7% |
[ 5.5% - 6.0% ] 5.80% | 4,187 | 2.6% |
[ 6.0% - 6.5% ] 6.09% | 197 | 4.1% |
[ 6.0% - 6.5% ] 6.24% | 1,217 | 1.1% |
[ 6.0% - 6.5% ] 6.33% | 158 | 2.8% |
[ 6.0% - 6.5% ] 6.40% | 250 | 11.2% |
[ 7.0% - 7.5% ] 7.27% | 1,086 | 3.3% |
[ 7.0% - 7.5% ] 7.33% | 2,647 | 2.7% |
[ 7.5% - 8.0% ] 7.81% | 1,268 | 9.6% |
[ 8.5% - 9.0% ] 8.58% | 536 | 0.40% |
[ 8.5% - 9.0% ] 8.61% | 360 | 7.1% |
[ 9.5% - 10.0% ] 9.76% | 1,475 | 6.8% |
[ 9.5% - 10.0% ] 9.84% | 183 | 2.9% |
[ 11.5% - 12.0% ] 11.57% | 1,132 | 2.5% |
[ 12.5% - 13.0% ] 12.87% | 404 | 4.7% |
[ 15.5% - 16.0% ] 15.86% | 309 | 4.8% |