Pakistani GED/Equivalency
COMPARE
Pakistani
Select to Compare
GED/Equivalency
Pakistani GED/Equivalency
86.4%
GED/EQUIVALENCY
80.4/ 100
METRIC RATING
145th/ 347
METRIC RANK
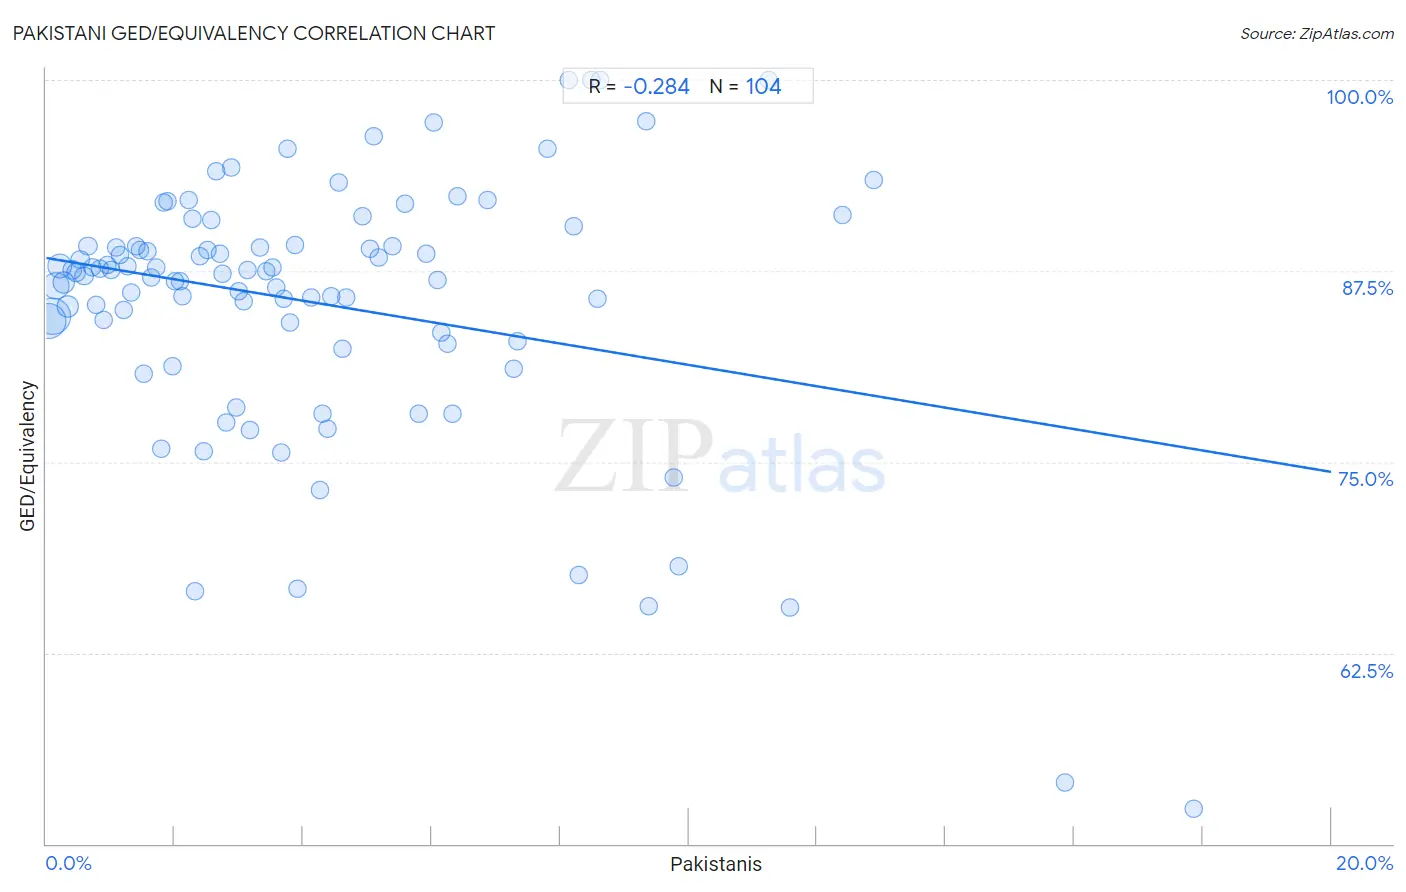
Pakistani GED/Equivalency Correlation Chart
The statistical analysis conducted on geographies consisting of 335,356,802 people shows a weak negative correlation between the proportion of Pakistanis and percentage of population with at least ged/equivalency education in the United States with a correlation coefficient (R) of -0.284 and weighted average of 86.4%. On average, for every 1% (one percent) increase in Pakistanis within a typical geography, there is a decrease of 0.70% in percentage of population with at least ged/equivalency education.
It is essential to understand that the correlation between the percentage of Pakistanis and percentage of population with at least ged/equivalency education does not imply a direct cause-and-effect relationship. It remains uncertain whether the presence of Pakistanis influences an upward or downward trend in the level of percentage of population with at least ged/equivalency education within an area, or if Pakistanis simply ended up residing in those areas with higher or lower levels of percentage of population with at least ged/equivalency education due to other factors.
Demographics Similar to Pakistanis by GED/Equivalency
In terms of ged/equivalency, the demographic groups most similar to Pakistanis are Basque (86.4%, a difference of 0.030%), Immigrants from Northern Africa (86.3%, a difference of 0.030%), Immigrants from Poland (86.3%, a difference of 0.030%), Menominee (86.3%, a difference of 0.040%), and Immigrants from Western Asia (86.3%, a difference of 0.050%).
| Demographics | Rating | Rank | GED/Equivalency |
| Immigrants from Argentina | 86.5 /100 | #138 | Excellent 86.6% |
| Immigrants from Malaysia | 85.0 /100 | #139 | Excellent 86.5% |
| Paraguayans | 84.1 /100 | #140 | Excellent 86.5% |
| Laotians | 83.2 /100 | #141 | Excellent 86.5% |
| Immigrants from Indonesia | 82.4 /100 | #142 | Excellent 86.4% |
| Immigrants from Pakistan | 82.4 /100 | #143 | Excellent 86.4% |
| Bolivians | 82.1 /100 | #144 | Excellent 86.4% |
| Pakistanis | 80.4 /100 | #145 | Excellent 86.4% |
| Basques | 79.5 /100 | #146 | Good 86.4% |
| Immigrants from Northern Africa | 79.3 /100 | #147 | Good 86.3% |
| Immigrants from Poland | 79.3 /100 | #148 | Good 86.3% |
| Menominee | 79.3 /100 | #149 | Good 86.3% |
| Immigrants from Western Asia | 78.8 /100 | #150 | Good 86.3% |
| Immigrants from Bosnia and Herzegovina | 77.9 /100 | #151 | Good 86.3% |
| Brazilians | 77.2 /100 | #152 | Good 86.3% |
Pakistani GED/Equivalency Correlation Summary
| Measurement | Pakistani Data | GED/Equivalency Data |
| Minimum | 0.034% | 52.3% |
| Maximum | 17.9% | 100.0% |
| Range | 17.8% | 47.7% |
| Mean | 4.2% | 85.4% |
| Median | 3.3% | 87.3% |
| Interquartile 25% (IQ1) | 1.6% | 83.2% |
| Interquartile 75% (IQ3) | 6.0% | 89.1% |
| Interquartile Range (IQR) | 4.4% | 5.9% |
| Standard Deviation (Sample) | 3.5% | 8.6% |
| Standard Deviation (Population) | 3.5% | 8.6% |
Correlation Details
| Pakistani Percentile | Sample Size | GED/Equivalency |
[ 0.0% - 0.5% ] 0.034% | 90,061,115 | 84.2% |
[ 0.0% - 0.5% ] 0.091% | 93,805,272 | 84.5% |
[ 0.0% - 0.5% ] 0.15% | 47,669,968 | 86.5% |
[ 0.0% - 0.5% ] 0.21% | 33,691,616 | 87.8% |
[ 0.0% - 0.5% ] 0.28% | 18,782,769 | 86.8% |
[ 0.0% - 0.5% ] 0.34% | 16,639,426 | 85.2% |
[ 0.0% - 0.5% ] 0.40% | 8,473,504 | 87.6% |
[ 0.0% - 0.5% ] 0.46% | 6,993,987 | 87.4% |
[ 0.5% - 1.0% ] 0.52% | 4,149,881 | 88.3% |
[ 0.5% - 1.0% ] 0.59% | 3,080,272 | 87.2% |
[ 0.5% - 1.0% ] 0.65% | 2,242,509 | 89.1% |
[ 0.5% - 1.0% ] 0.72% | 1,925,598 | 87.7% |
[ 0.5% - 1.0% ] 0.77% | 1,317,313 | 85.3% |
[ 0.5% - 1.0% ] 0.83% | 1,147,157 | 87.6% |
[ 0.5% - 1.0% ] 0.90% | 863,852 | 84.3% |
[ 0.5% - 1.0% ] 0.95% | 752,692 | 87.9% |
[ 1.0% - 1.5% ] 1.02% | 423,632 | 87.6% |
[ 1.0% - 1.5% ] 1.08% | 293,632 | 89.0% |
[ 1.0% - 1.5% ] 1.14% | 231,179 | 88.5% |
[ 1.0% - 1.5% ] 1.21% | 305,694 | 85.0% |
[ 1.0% - 1.5% ] 1.26% | 261,627 | 87.8% |
[ 1.0% - 1.5% ] 1.32% | 235,940 | 86.1% |
[ 1.0% - 1.5% ] 1.39% | 285,454 | 89.1% |
[ 1.0% - 1.5% ] 1.46% | 187,114 | 88.9% |
[ 1.5% - 2.0% ] 1.51% | 260,747 | 80.7% |
[ 1.5% - 2.0% ] 1.57% | 138,478 | 88.8% |
[ 1.5% - 2.0% ] 1.64% | 145,850 | 87.1% |
[ 1.5% - 2.0% ] 1.70% | 151,933 | 87.7% |
[ 1.5% - 2.0% ] 1.78% | 188,869 | 75.9% |
[ 1.5% - 2.0% ] 1.83% | 74,625 | 92.0% |
[ 1.5% - 2.0% ] 1.89% | 54,729 | 92.1% |
[ 1.5% - 2.0% ] 1.96% | 52,852 | 81.3% |
[ 2.0% - 2.5% ] 2.01% | 53,593 | 86.8% |
[ 2.0% - 2.5% ] 2.08% | 17,410 | 86.9% |
[ 2.0% - 2.5% ] 2.13% | 66,168 | 85.8% |
[ 2.0% - 2.5% ] 2.21% | 24,707 | 92.2% |
[ 2.0% - 2.5% ] 2.27% | 25,953 | 90.9% |
[ 2.0% - 2.5% ] 2.32% | 1,596 | 66.5% |
[ 2.0% - 2.5% ] 2.39% | 14,274 | 88.4% |
[ 2.0% - 2.5% ] 2.45% | 10,378 | 75.7% |
[ 2.5% - 3.0% ] 2.50% | 9,108 | 88.9% |
[ 2.5% - 3.0% ] 2.56% | 15,140 | 90.8% |
[ 2.5% - 3.0% ] 2.64% | 6,588 | 94.0% |
[ 2.5% - 3.0% ] 2.70% | 5,768 | 88.6% |
[ 2.5% - 3.0% ] 2.74% | 58,031 | 87.3% |
[ 2.5% - 3.0% ] 2.80% | 1,357 | 77.6% |
[ 2.5% - 3.0% ] 2.88% | 11,457 | 94.3% |
[ 2.5% - 3.0% ] 2.95% | 746 | 78.6% |
[ 3.0% - 3.5% ] 3.00% | 3,828 | 86.2% |
[ 3.0% - 3.5% ] 3.07% | 17,806 | 85.5% |
[ 3.0% - 3.5% ] 3.13% | 15,816 | 87.6% |
[ 3.0% - 3.5% ] 3.18% | 3,113 | 77.1% |
[ 3.0% - 3.5% ] 3.33% | 2,762 | 89.0% |
[ 3.0% - 3.5% ] 3.43% | 4,085 | 87.5% |
[ 3.5% - 4.0% ] 3.51% | 1,452 | 87.7% |
[ 3.5% - 4.0% ] 3.59% | 3,373 | 86.4% |
[ 3.5% - 4.0% ] 3.65% | 630 | 75.6% |
[ 3.5% - 4.0% ] 3.69% | 1,002 | 85.7% |
[ 3.5% - 4.0% ] 3.75% | 587 | 95.5% |
[ 3.5% - 4.0% ] 3.80% | 15,200 | 84.2% |
[ 3.5% - 4.0% ] 3.87% | 1,033 | 89.2% |
[ 3.5% - 4.0% ] 3.91% | 16,277 | 66.7% |
[ 4.0% - 4.5% ] 4.13% | 1,478 | 85.7% |
[ 4.0% - 4.5% ] 4.25% | 10,278 | 73.2% |
[ 4.0% - 4.5% ] 4.31% | 4,503 | 78.1% |
[ 4.0% - 4.5% ] 4.37% | 7,757 | 77.2% |
[ 4.0% - 4.5% ] 4.44% | 540 | 85.9% |
[ 4.5% - 5.0% ] 4.55% | 2,243 | 93.3% |
[ 4.5% - 5.0% ] 4.62% | 390 | 82.4% |
[ 4.5% - 5.0% ] 4.67% | 664 | 85.7% |
[ 4.5% - 5.0% ] 4.91% | 468 | 91.1% |
[ 5.0% - 5.5% ] 5.03% | 3,120 | 88.9% |
[ 5.0% - 5.5% ] 5.09% | 216 | 96.4% |
[ 5.0% - 5.5% ] 5.18% | 1,235 | 88.4% |
[ 5.0% - 5.5% ] 5.39% | 1,577 | 89.1% |
[ 5.5% - 6.0% ] 5.59% | 2,898 | 91.9% |
[ 5.5% - 6.0% ] 5.80% | 4,187 | 78.1% |
[ 5.5% - 6.0% ] 5.92% | 152 | 88.6% |
[ 6.0% - 6.5% ] 6.03% | 564 | 97.3% |
[ 6.0% - 6.5% ] 6.09% | 197 | 86.9% |
[ 6.0% - 6.5% ] 6.14% | 114 | 83.5% |
[ 6.0% - 6.5% ] 6.24% | 1,217 | 82.7% |
[ 6.0% - 6.5% ] 6.33% | 158 | 78.1% |
[ 6.0% - 6.5% ] 6.40% | 250 | 92.4% |
[ 6.5% - 7.0% ] 6.87% | 262 | 92.1% |
[ 7.0% - 7.5% ] 7.27% | 1,086 | 81.1% |
[ 7.0% - 7.5% ] 7.33% | 2,647 | 82.9% |
[ 7.5% - 8.0% ] 7.81% | 1,268 | 95.5% |
[ 8.0% - 8.5% ] 8.14% | 467 | 100.0% |
[ 8.0% - 8.5% ] 8.22% | 73 | 90.4% |
[ 8.0% - 8.5% ] 8.28% | 483 | 67.6% |
[ 8.0% - 8.5% ] 8.47% | 177 | 100.0% |
[ 8.5% - 9.0% ] 8.58% | 536 | 85.7% |
[ 8.5% - 9.0% ] 8.61% | 360 | 100.0% |
[ 9.0% - 9.5% ] 9.35% | 2,332 | 97.3% |
[ 9.0% - 9.5% ] 9.38% | 96 | 65.5% |
[ 9.5% - 10.0% ] 9.76% | 1,475 | 74.0% |
[ 9.5% - 10.0% ] 9.84% | 183 | 68.2% |
[ 11.0% - 11.5% ] 11.24% | 169 | 100.0% |
[ 11.5% - 12.0% ] 11.57% | 1,132 | 65.5% |
[ 12.0% - 12.5% ] 12.39% | 557 | 91.2% |
[ 12.5% - 13.0% ] 12.87% | 404 | 93.4% |
[ 15.5% - 16.0% ] 15.86% | 309 | 54.0% |
[ 17.5% - 18.0% ] 17.86% | 56 | 52.3% |