Pakistani Unemployment Among Women with Children Ages 6 to 17 years
COMPARE
Pakistani
Select to Compare
Unemployment Among Women with Children Ages 6 to 17 years
Pakistani Unemployment Among Women with Children Ages 6 to 17 years
8.4%
UNEMPLOYMENT | WOMEN W/ CHILDREN 6 TO 17
99.6/ 100
METRIC RATING
78th/ 347
METRIC RANK
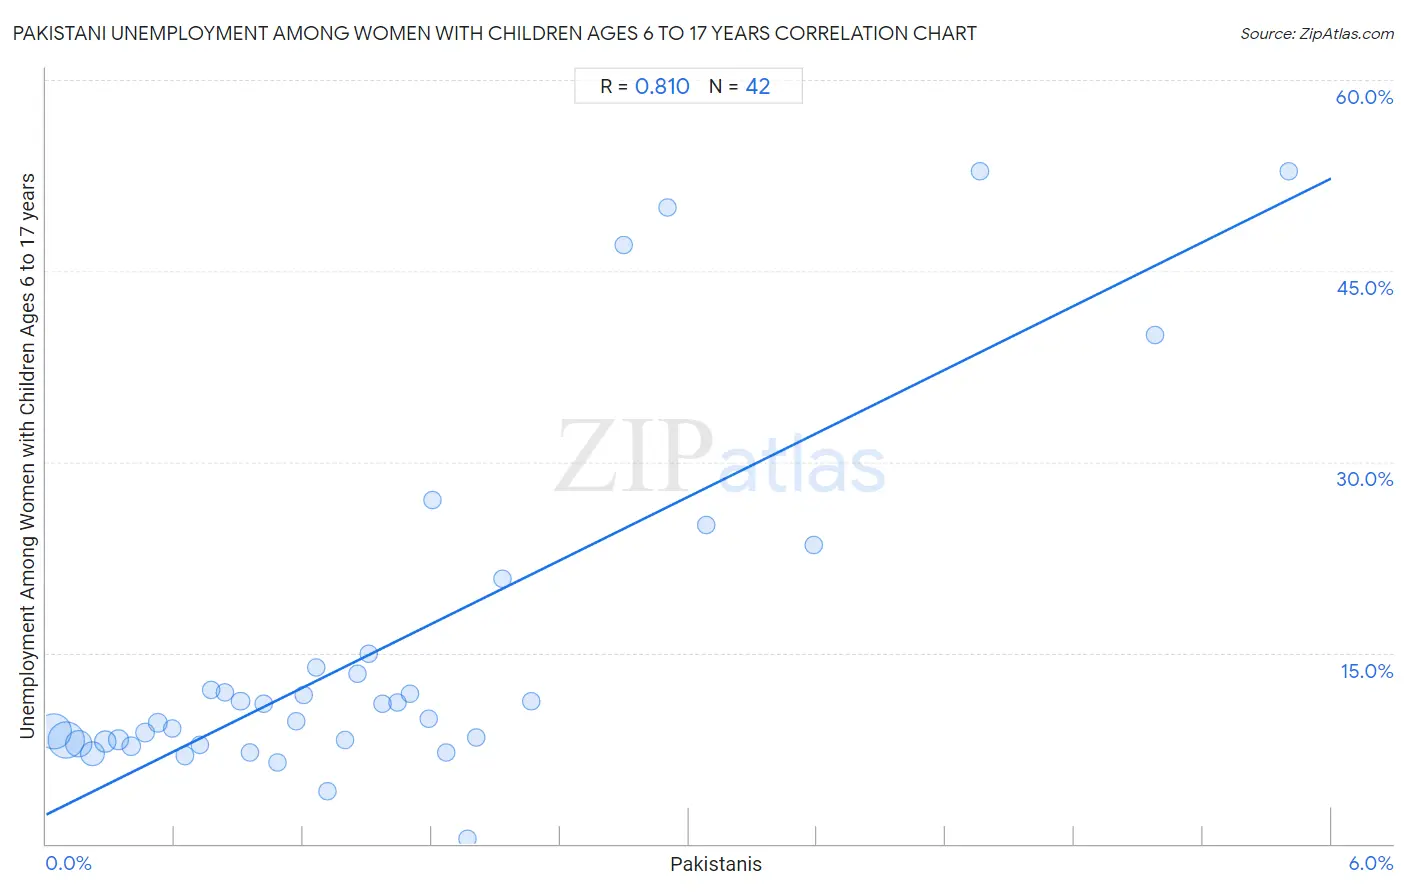
Pakistani Unemployment Among Women with Children Ages 6 to 17 years Correlation Chart
The statistical analysis conducted on geographies consisting of 251,939,876 people shows a very strong positive correlation between the proportion of Pakistanis and unemployment rate among women with children between the ages 6 and 17 in the United States with a correlation coefficient (R) of 0.810 and weighted average of 8.4%. On average, for every 1% (one percent) increase in Pakistanis within a typical geography, there is an increase of 8.3% in unemployment rate among women with children between the ages 6 and 17.
It is essential to understand that the correlation between the percentage of Pakistanis and unemployment rate among women with children between the ages 6 and 17 does not imply a direct cause-and-effect relationship. It remains uncertain whether the presence of Pakistanis influences an upward or downward trend in the level of unemployment rate among women with children between the ages 6 and 17 within an area, or if Pakistanis simply ended up residing in those areas with higher or lower levels of unemployment rate among women with children between the ages 6 and 17 due to other factors.
Demographics Similar to Pakistanis by Unemployment Among Women with Children Ages 6 to 17 years
In terms of unemployment among women with children ages 6 to 17 years, the demographic groups most similar to Pakistanis are Mongolian (8.4%, a difference of 0.010%), Immigrants from Belarus (8.4%, a difference of 0.050%), Iraqi (8.4%, a difference of 0.14%), Immigrants from Bolivia (8.4%, a difference of 0.17%), and Immigrants from Moldova (8.4%, a difference of 0.19%).
| Demographics | Rating | Rank | Unemployment Among Women with Children Ages 6 to 17 years |
| Immigrants from Australia | 99.8 /100 | #71 | Exceptional 8.3% |
| Immigrants from Nepal | 99.8 /100 | #72 | Exceptional 8.3% |
| Spanish Americans | 99.8 /100 | #73 | Exceptional 8.4% |
| Samoans | 99.7 /100 | #74 | Exceptional 8.4% |
| Immigrants from Sri Lanka | 99.7 /100 | #75 | Exceptional 8.4% |
| Immigrants from Moldova | 99.7 /100 | #76 | Exceptional 8.4% |
| Iraqis | 99.7 /100 | #77 | Exceptional 8.4% |
| Pakistanis | 99.6 /100 | #78 | Exceptional 8.4% |
| Mongolians | 99.6 /100 | #79 | Exceptional 8.4% |
| Immigrants from Belarus | 99.6 /100 | #80 | Exceptional 8.4% |
| Immigrants from Bolivia | 99.6 /100 | #81 | Exceptional 8.4% |
| Cypriots | 99.6 /100 | #82 | Exceptional 8.4% |
| Bulgarians | 99.5 /100 | #83 | Exceptional 8.4% |
| Japanese | 99.5 /100 | #84 | Exceptional 8.4% |
| Immigrants from North Macedonia | 99.4 /100 | #85 | Exceptional 8.5% |
Pakistani Unemployment Among Women with Children Ages 6 to 17 years Correlation Summary
| Measurement | Pakistani Data | Unemployment Among Women with Children Ages 6 to 17 years Data |
| Minimum | 0.034% | 0.40% |
| Maximum | 5.8% | 52.8% |
| Range | 5.8% | 52.4% |
| Mean | 1.6% | 15.3% |
| Median | 1.3% | 10.4% |
| Interquartile 25% (IQ1) | 0.65% | 8.0% |
| Interquartile 75% (IQ3) | 2.0% | 13.8% |
| Interquartile Range (IQR) | 1.3% | 5.8% |
| Standard Deviation (Sample) | 1.3% | 13.5% |
| Standard Deviation (Population) | 1.3% | 13.3% |
Correlation Details
| Pakistani Percentile | Sample Size | Unemployment Among Women with Children Ages 6 to 17 years |
[ 0.0% - 0.5% ] 0.034% | 69,468,224 | 8.8% |
[ 0.0% - 0.5% ] 0.091% | 75,437,925 | 8.1% |
[ 0.0% - 0.5% ] 0.15% | 35,661,358 | 7.9% |
[ 0.0% - 0.5% ] 0.21% | 25,243,764 | 7.1% |
[ 0.0% - 0.5% ] 0.28% | 12,834,274 | 8.0% |
[ 0.0% - 0.5% ] 0.34% | 12,078,439 | 8.2% |
[ 0.0% - 0.5% ] 0.40% | 5,297,009 | 7.6% |
[ 0.0% - 0.5% ] 0.46% | 4,423,371 | 8.8% |
[ 0.5% - 1.0% ] 0.52% | 2,666,712 | 9.5% |
[ 0.5% - 1.0% ] 0.59% | 2,087,500 | 9.0% |
[ 0.5% - 1.0% ] 0.65% | 1,242,145 | 6.9% |
[ 0.5% - 1.0% ] 0.72% | 1,227,577 | 7.8% |
[ 0.5% - 1.0% ] 0.77% | 753,141 | 12.1% |
[ 0.5% - 1.0% ] 0.83% | 738,889 | 11.9% |
[ 0.5% - 1.0% ] 0.91% | 495,131 | 11.2% |
[ 0.5% - 1.0% ] 0.95% | 423,796 | 7.2% |
[ 1.0% - 1.5% ] 1.02% | 300,117 | 11.0% |
[ 1.0% - 1.5% ] 1.08% | 94,923 | 6.4% |
[ 1.0% - 1.5% ] 1.16% | 93,510 | 9.7% |
[ 1.0% - 1.5% ] 1.20% | 138,159 | 11.6% |
[ 1.0% - 1.5% ] 1.26% | 176,057 | 13.8% |
[ 1.0% - 1.5% ] 1.31% | 172,499 | 4.1% |
[ 1.0% - 1.5% ] 1.39% | 168,871 | 8.2% |
[ 1.0% - 1.5% ] 1.45% | 45,570 | 13.4% |
[ 1.5% - 2.0% ] 1.51% | 151,074 | 14.9% |
[ 1.5% - 2.0% ] 1.57% | 77,897 | 11.0% |
[ 1.5% - 2.0% ] 1.64% | 53,333 | 11.1% |
[ 1.5% - 2.0% ] 1.70% | 113,775 | 11.7% |
[ 1.5% - 2.0% ] 1.78% | 163,072 | 9.8% |
[ 1.5% - 2.0% ] 1.80% | 7,703 | 27.0% |
[ 1.5% - 2.0% ] 1.87% | 12,672 | 7.2% |
[ 1.5% - 2.0% ] 1.97% | 25,699 | 0.40% |
[ 2.0% - 2.5% ] 2.01% | 9,412 | 8.3% |
[ 2.0% - 2.5% ] 2.13% | 29,407 | 20.8% |
[ 2.0% - 2.5% ] 2.27% | 10,456 | 11.2% |
[ 2.5% - 3.0% ] 2.70% | 2,819 | 47.0% |
[ 2.5% - 3.0% ] 2.90% | 552 | 50.0% |
[ 3.0% - 3.5% ] 3.08% | 974 | 25.0% |
[ 3.5% - 4.0% ] 3.58% | 1,367 | 23.5% |
[ 4.0% - 4.5% ] 4.36% | 5,570 | 52.8% |
[ 5.0% - 5.5% ] 5.18% | 946 | 40.0% |
[ 5.5% - 6.0% ] 5.80% | 4,187 | 52.8% |