Norwegian 4 or more Vehicles in Household
COMPARE
Norwegian
Select to Compare
4 or more Vehicles in Household
Norwegian 4 or more Vehicles in Household
8.0%
4+ VEHICLES AVAILABLE
100.0/ 100
METRIC RATING
36th/ 347
METRIC RANK
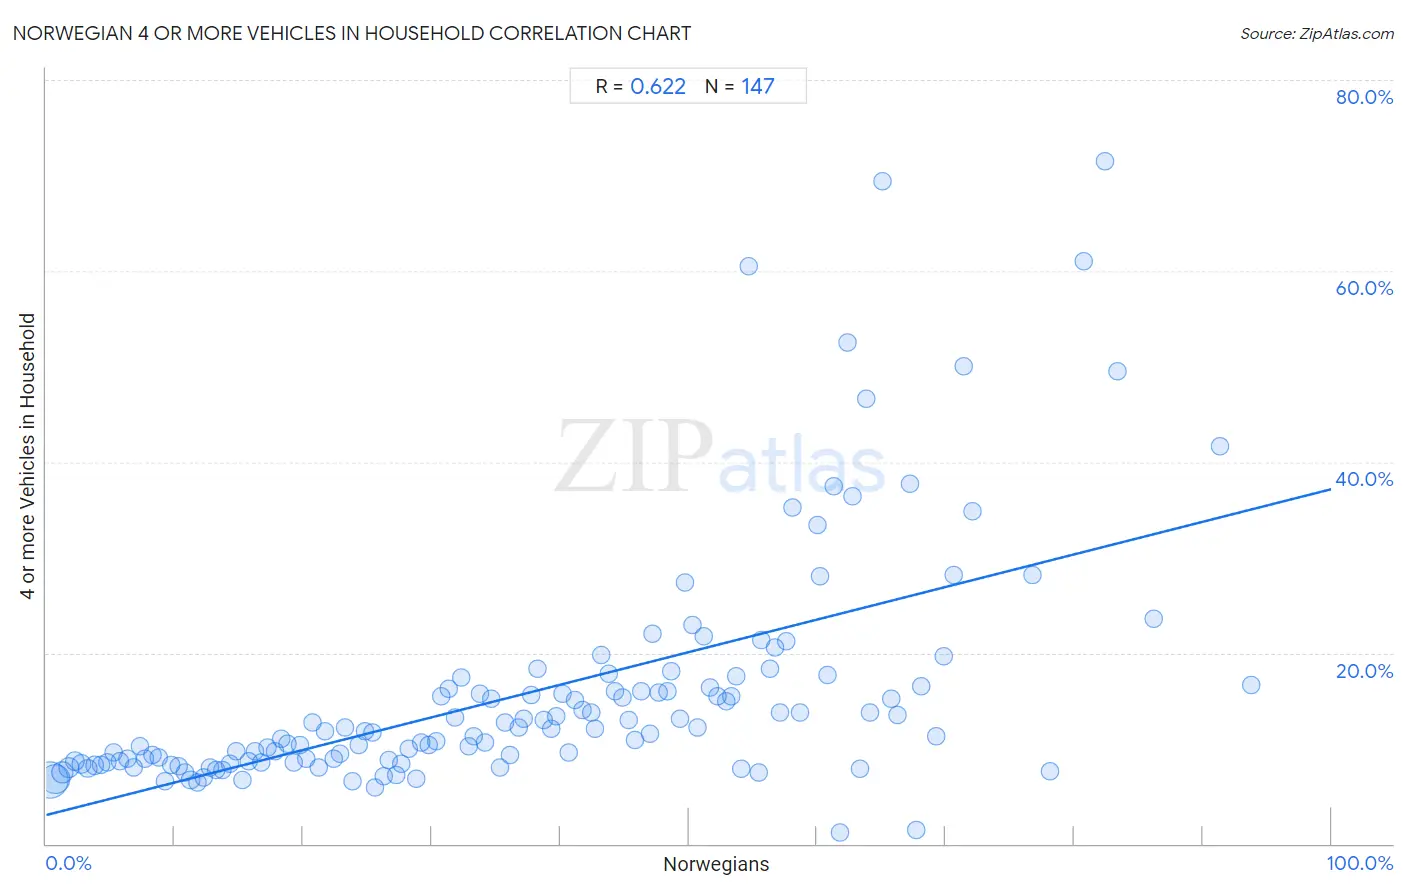
Norwegian 4 or more Vehicles in Household Correlation Chart
The statistical analysis conducted on geographies consisting of 530,553,838 people shows a significant positive correlation between the proportion of Norwegians and percentage of households with 4 or more vehicles available in the United States with a correlation coefficient (R) of 0.622 and weighted average of 8.0%. On average, for every 1% (one percent) increase in Norwegians within a typical geography, there is an increase of 0.34% in percentage of households with 4 or more vehicles available.
It is essential to understand that the correlation between the percentage of Norwegians and percentage of households with 4 or more vehicles available does not imply a direct cause-and-effect relationship. It remains uncertain whether the presence of Norwegians influences an upward or downward trend in the level of percentage of households with 4 or more vehicles available within an area, or if Norwegians simply ended up residing in those areas with higher or lower levels of percentage of households with 4 or more vehicles available due to other factors.
Demographics Similar to Norwegians by 4 or more Vehicles in Household
In terms of 4 or more vehicles in household, the demographic groups most similar to Norwegians are Scandinavian (8.0%, a difference of 0.17%), Sioux (8.0%, a difference of 0.20%), Spanish American (8.0%, a difference of 0.43%), Guamanian/Chamorro (8.1%, a difference of 0.79%), and Alaskan Athabascan (8.1%, a difference of 0.99%).
| Demographics | Rating | Rank | 4 or more Vehicles in Household |
| Immigrants from South Eastern Asia | 100.0 /100 | #29 | Exceptional 8.2% |
| Navajo | 100.0 /100 | #30 | Exceptional 8.2% |
| Natives/Alaskans | 100.0 /100 | #31 | Exceptional 8.2% |
| Marshallese | 100.0 /100 | #32 | Exceptional 8.1% |
| Yaqui | 100.0 /100 | #33 | Exceptional 8.1% |
| Alaskan Athabascans | 100.0 /100 | #34 | Exceptional 8.1% |
| Guamanians/Chamorros | 100.0 /100 | #35 | Exceptional 8.1% |
| Norwegians | 100.0 /100 | #36 | Exceptional 8.0% |
| Scandinavians | 100.0 /100 | #37 | Exceptional 8.0% |
| Sioux | 100.0 /100 | #38 | Exceptional 8.0% |
| Spanish Americans | 100.0 /100 | #39 | Exceptional 8.0% |
| Spanish | 100.0 /100 | #40 | Exceptional 7.9% |
| Pima | 100.0 /100 | #41 | Exceptional 7.9% |
| Salvadorans | 100.0 /100 | #42 | Exceptional 7.8% |
| Fijians | 100.0 /100 | #43 | Exceptional 7.8% |
Norwegian 4 or more Vehicles in Household Correlation Summary
| Measurement | Norwegian Data | 4 or more Vehicles in Household Data |
| Minimum | 0.25% | 1.2% |
| Maximum | 93.8% | 71.4% |
| Range | 93.5% | 70.2% |
| Mean | 37.6% | 15.8% |
| Median | 36.8% | 11.8% |
| Interquartile 25% (IQ1) | 18.3% | 8.6% |
| Interquartile 75% (IQ3) | 55.5% | 16.5% |
| Interquartile Range (IQR) | 37.2% | 7.9% |
| Standard Deviation (Sample) | 22.8% | 12.5% |
| Standard Deviation (Population) | 22.7% | 12.5% |
Correlation Details
| Norwegian Percentile | Sample Size | 4 or more Vehicles in Household |
[ 0.0% - 0.5% ] 0.25% | 236,005,792 | 6.6% |
[ 0.5% - 1.0% ] 0.71% | 133,935,826 | 6.8% |
[ 1.0% - 1.5% ] 1.22% | 51,099,591 | 7.5% |
[ 1.5% - 2.0% ] 1.73% | 28,828,602 | 7.9% |
[ 2.0% - 2.5% ] 2.24% | 18,330,601 | 8.6% |
[ 2.5% - 3.0% ] 2.74% | 11,604,532 | 8.4% |
[ 3.0% - 3.5% ] 3.25% | 8,578,416 | 7.9% |
[ 3.5% - 4.0% ] 3.77% | 7,409,328 | 8.2% |
[ 4.0% - 4.5% ] 4.24% | 5,141,875 | 8.3% |
[ 4.5% - 5.0% ] 4.73% | 3,732,792 | 8.5% |
[ 5.0% - 5.5% ] 5.24% | 2,245,640 | 9.6% |
[ 5.5% - 6.0% ] 5.77% | 2,188,555 | 8.7% |
[ 6.0% - 6.5% ] 6.29% | 1,864,493 | 8.9% |
[ 6.5% - 7.0% ] 6.80% | 1,778,058 | 8.0% |
[ 7.0% - 7.5% ] 7.28% | 1,072,622 | 10.3% |
[ 7.5% - 8.0% ] 7.72% | 1,114,331 | 8.9% |
[ 8.0% - 8.5% ] 8.24% | 684,012 | 9.2% |
[ 8.5% - 9.0% ] 8.79% | 671,629 | 9.1% |
[ 9.0% - 9.5% ] 9.25% | 1,001,588 | 6.5% |
[ 9.5% - 10.0% ] 9.75% | 938,117 | 8.2% |
[ 10.0% - 10.5% ] 10.27% | 657,098 | 8.1% |
[ 10.5% - 11.0% ] 10.76% | 998,462 | 7.4% |
[ 11.0% - 11.5% ] 11.23% | 995,791 | 6.7% |
[ 11.5% - 12.0% ] 11.75% | 1,041,118 | 6.4% |
[ 12.0% - 12.5% ] 12.27% | 1,084,569 | 7.0% |
[ 12.5% - 13.0% ] 12.74% | 641,420 | 8.0% |
[ 13.0% - 13.5% ] 13.22% | 844,078 | 7.7% |
[ 13.5% - 14.0% ] 13.72% | 592,292 | 7.7% |
[ 14.0% - 14.5% ] 14.27% | 552,047 | 8.4% |
[ 14.5% - 15.0% ] 14.74% | 507,299 | 9.6% |
[ 15.0% - 15.5% ] 15.24% | 431,212 | 6.7% |
[ 15.5% - 16.0% ] 15.75% | 419,004 | 8.7% |
[ 16.0% - 16.5% ] 16.22% | 232,095 | 9.7% |
[ 16.5% - 17.0% ] 16.72% | 358,242 | 8.6% |
[ 17.0% - 17.5% ] 17.19% | 208,198 | 10.0% |
[ 17.5% - 18.0% ] 17.79% | 169,333 | 9.7% |
[ 18.0% - 18.5% ] 18.26% | 167,790 | 11.0% |
[ 18.5% - 19.0% ] 18.74% | 108,520 | 10.5% |
[ 19.0% - 19.5% ] 19.22% | 92,119 | 8.6% |
[ 19.5% - 20.0% ] 19.75% | 79,082 | 10.4% |
[ 20.0% - 20.5% ] 20.24% | 179,859 | 9.0% |
[ 20.5% - 21.0% ] 20.72% | 62,028 | 12.8% |
[ 21.0% - 21.5% ] 21.24% | 106,238 | 7.9% |
[ 21.5% - 22.0% ] 21.74% | 77,462 | 11.8% |
[ 22.0% - 22.5% ] 22.34% | 78,463 | 8.9% |
[ 22.5% - 23.0% ] 22.81% | 85,950 | 9.4% |
[ 23.0% - 23.5% ] 23.22% | 45,760 | 12.2% |
[ 23.5% - 24.0% ] 23.85% | 88,250 | 6.6% |
[ 24.0% - 24.5% ] 24.30% | 27,787 | 10.3% |
[ 24.5% - 25.0% ] 24.83% | 54,754 | 11.8% |
[ 25.0% - 25.5% ] 25.35% | 50,292 | 11.6% |
[ 25.5% - 26.0% ] 25.63% | 211,047 | 5.9% |
[ 26.0% - 26.5% ] 26.22% | 137,267 | 7.1% |
[ 26.5% - 27.0% ] 26.61% | 45,988 | 8.7% |
[ 27.0% - 27.5% ] 27.20% | 156,953 | 7.2% |
[ 27.5% - 28.0% ] 27.63% | 65,991 | 8.4% |
[ 28.0% - 28.5% ] 28.23% | 22,763 | 9.9% |
[ 28.5% - 29.0% ] 28.79% | 102,066 | 6.8% |
[ 29.0% - 29.5% ] 29.21% | 46,374 | 10.6% |
[ 29.5% - 30.0% ] 29.73% | 32,384 | 10.4% |
[ 30.0% - 30.5% ] 30.31% | 30,591 | 10.7% |
[ 30.5% - 31.0% ] 30.72% | 16,604 | 15.5% |
[ 31.0% - 31.5% ] 31.35% | 16,875 | 16.2% |
[ 31.5% - 32.0% ] 31.80% | 14,109 | 13.3% |
[ 32.0% - 32.5% ] 32.26% | 12,026 | 17.4% |
[ 32.5% - 33.0% ] 32.85% | 36,249 | 10.3% |
[ 33.0% - 33.5% ] 33.26% | 32,165 | 11.2% |
[ 33.5% - 34.0% ] 33.80% | 8,951 | 15.8% |
[ 34.0% - 34.5% ] 34.18% | 25,603 | 10.6% |
[ 34.5% - 35.0% ] 34.66% | 13,472 | 15.2% |
[ 35.0% - 35.5% ] 35.26% | 20,885 | 7.9% |
[ 35.5% - 36.0% ] 35.74% | 21,116 | 12.7% |
[ 36.0% - 36.5% ] 36.12% | 35,380 | 9.3% |
[ 36.5% - 37.0% ] 36.76% | 14,430 | 12.1% |
[ 37.0% - 37.5% ] 37.18% | 7,349 | 13.0% |
[ 37.5% - 38.0% ] 37.72% | 11,183 | 15.6% |
[ 38.0% - 38.5% ] 38.22% | 11,232 | 18.3% |
[ 38.5% - 39.0% ] 38.73% | 9,972 | 12.9% |
[ 39.0% - 39.5% ] 39.26% | 7,499 | 12.0% |
[ 39.5% - 40.0% ] 39.69% | 5,775 | 13.3% |
[ 40.0% - 40.5% ] 40.21% | 4,397 | 15.7% |
[ 40.5% - 41.0% ] 40.64% | 10,233 | 9.6% |
[ 41.0% - 41.5% ] 41.19% | 6,043 | 15.1% |
[ 41.5% - 42.0% ] 41.68% | 5,009 | 14.0% |
[ 42.0% - 42.5% ] 42.41% | 9,411 | 13.8% |
[ 42.5% - 43.0% ] 42.74% | 8,523 | 12.0% |
[ 43.0% - 43.5% ] 43.21% | 2,988 | 19.7% |
[ 43.5% - 44.0% ] 43.77% | 3,299 | 17.9% |
[ 44.0% - 44.5% ] 44.29% | 2,208 | 16.0% |
[ 44.5% - 45.0% ] 44.85% | 5,342 | 15.4% |
[ 45.0% - 45.5% ] 45.35% | 3,259 | 12.9% |
[ 45.5% - 46.0% ] 45.85% | 5,603 | 10.8% |
[ 46.0% - 46.5% ] 46.30% | 2,514 | 16.0% |
[ 46.5% - 47.0% ] 46.96% | 790 | 11.6% |
[ 47.0% - 47.5% ] 47.14% | 3,551 | 22.0% |
[ 47.5% - 48.0% ] 47.67% | 3,180 | 15.9% |
[ 48.0% - 48.5% ] 48.31% | 5,045 | 15.9% |
[ 48.5% - 49.0% ] 48.66% | 3,968 | 18.0% |
[ 49.0% - 49.5% ] 49.30% | 2,132 | 13.1% |
[ 49.5% - 50.0% ] 49.75% | 1,835 | 27.4% |
[ 50.0% - 50.5% ] 50.30% | 2,793 | 22.9% |
[ 50.5% - 51.0% ] 50.68% | 3,467 | 12.1% |
[ 51.0% - 51.5% ] 51.18% | 551 | 21.7% |
[ 51.5% - 52.0% ] 51.65% | 364 | 16.4% |
[ 52.0% - 52.5% ] 52.19% | 1,734 | 15.4% |
[ 52.5% - 53.0% ] 52.88% | 312 | 14.9% |
[ 53.0% - 53.5% ] 53.35% | 2,656 | 15.5% |
[ 53.5% - 54.0% ] 53.72% | 2,960 | 17.5% |
[ 54.0% - 54.5% ] 54.12% | 2,086 | 7.9% |
[ 54.5% - 55.0% ] 54.67% | 75 | 60.5% |
[ 55.0% - 55.5% ] 55.47% | 2,650 | 7.5% |
[ 55.5% - 56.0% ] 55.61% | 962 | 21.3% |
[ 56.0% - 56.5% ] 56.36% | 495 | 18.3% |
[ 56.5% - 57.0% ] 56.74% | 1,121 | 20.6% |
[ 57.0% - 57.5% ] 57.14% | 168 | 13.7% |
[ 57.5% - 58.0% ] 57.58% | 132 | 21.2% |
[ 58.0% - 58.5% ] 58.11% | 604 | 35.3% |
[ 58.5% - 59.0% ] 58.64% | 648 | 13.7% |
[ 60.0% - 60.5% ] 60.00% | 5 | 33.3% |
[ 60.0% - 60.5% ] 60.17% | 241 | 28.0% |
[ 60.5% - 61.0% ] 60.77% | 209 | 17.7% |
[ 61.0% - 61.5% ] 61.32% | 106 | 37.5% |
[ 61.5% - 62.0% ] 61.74% | 149 | 1.2% |
[ 62.0% - 62.5% ] 62.35% | 162 | 52.5% |
[ 62.5% - 63.0% ] 62.79% | 86 | 36.4% |
[ 63.0% - 63.5% ] 63.32% | 698 | 7.9% |
[ 63.5% - 64.0% ] 63.85% | 213 | 46.6% |
[ 64.0% - 64.5% ] 64.08% | 373 | 13.8% |
[ 65.0% - 65.5% ] 65.08% | 315 | 69.4% |
[ 65.5% - 66.0% ] 65.75% | 327 | 15.2% |
[ 66.0% - 66.5% ] 66.24% | 391 | 13.5% |
[ 67.0% - 67.5% ] 67.22% | 180 | 37.7% |
[ 67.5% - 68.0% ] 67.74% | 155 | 1.5% |
[ 68.0% - 68.5% ] 68.11% | 370 | 16.5% |
[ 69.0% - 69.5% ] 69.23% | 104 | 11.3% |
[ 69.5% - 70.0% ] 69.86% | 146 | 19.6% |
[ 70.5% - 71.0% ] 70.59% | 68 | 28.1% |
[ 71.0% - 71.5% ] 71.43% | 28 | 50.0% |
[ 72.0% - 72.5% ] 72.08% | 308 | 34.8% |
[ 76.5% - 77.0% ] 76.74% | 258 | 28.2% |
[ 78.0% - 78.5% ] 78.09% | 251 | 7.6% |
[ 80.5% - 81.0% ] 80.70% | 114 | 61.0% |
[ 82.0% - 82.5% ] 82.35% | 17 | 71.4% |
[ 83.0% - 83.5% ] 83.33% | 42 | 49.5% |
[ 86.0% - 86.5% ] 86.21% | 29 | 23.5% |
[ 91.0% - 91.5% ] 91.38% | 58 | 41.7% |
[ 93.5% - 94.0% ] 93.75% | 16 | 16.7% |