Norwegian Self-Care Disability
COMPARE
Norwegian
Select to Compare
Self-Care Disability
Norwegian Self-Care Disability
2.3%
SELF-CARE DISABILITY
99.8/ 100
METRIC RATING
45th/ 347
METRIC RANK
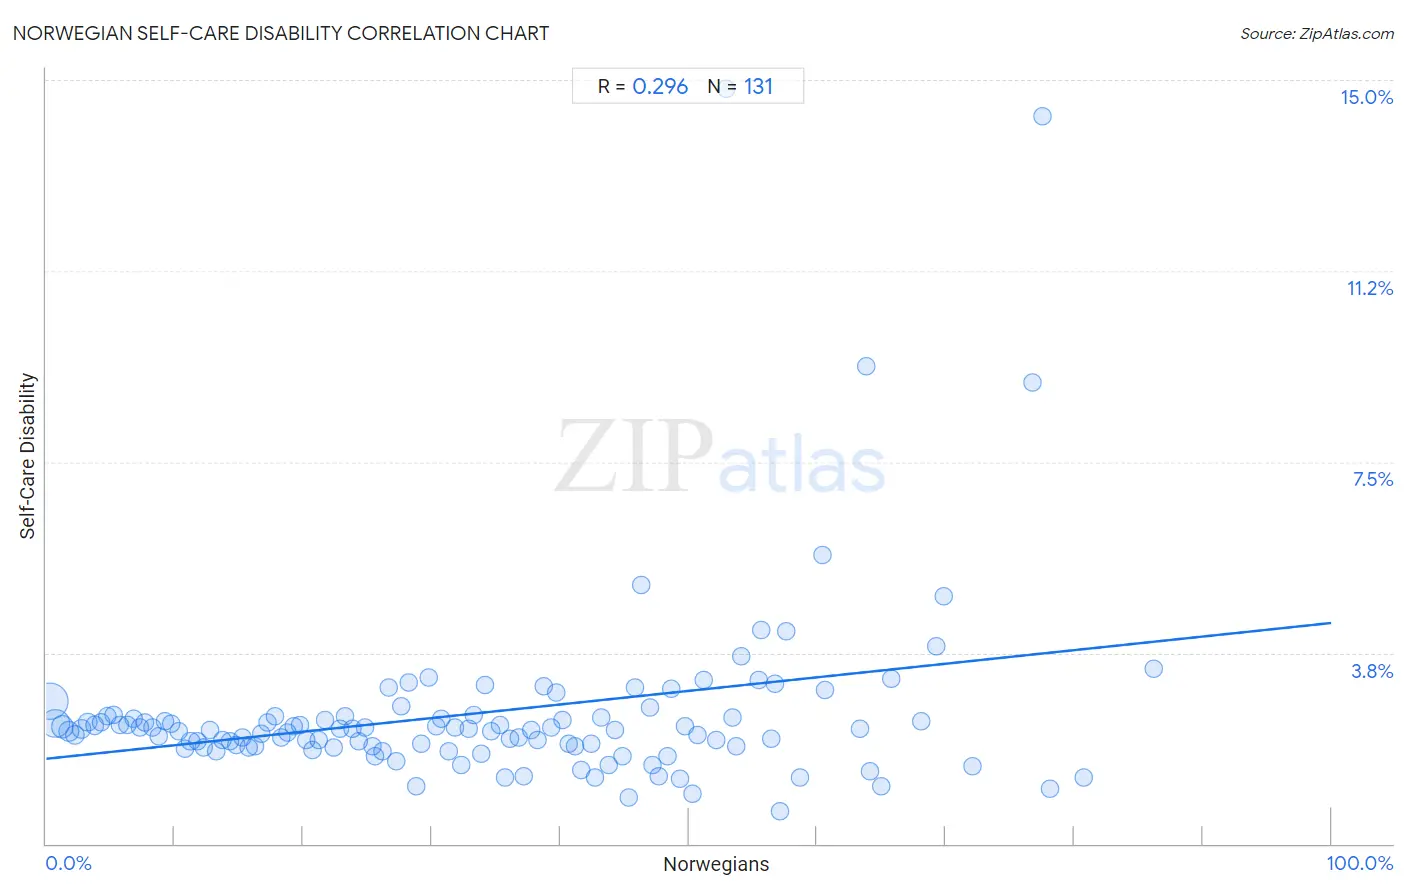
Norwegian Self-Care Disability Correlation Chart
The statistical analysis conducted on geographies consisting of 531,593,682 people shows a weak positive correlation between the proportion of Norwegians and percentage of population with self-care disability in the United States with a correlation coefficient (R) of 0.296 and weighted average of 2.3%. On average, for every 1% (one percent) increase in Norwegians within a typical geography, there is an increase of 0.027% in percentage of population with self-care disability.
It is essential to understand that the correlation between the percentage of Norwegians and percentage of population with self-care disability does not imply a direct cause-and-effect relationship. It remains uncertain whether the presence of Norwegians influences an upward or downward trend in the level of percentage of population with self-care disability within an area, or if Norwegians simply ended up residing in those areas with higher or lower levels of percentage of population with self-care disability due to other factors.
Demographics Similar to Norwegians by Self-Care Disability
In terms of self-care disability, the demographic groups most similar to Norwegians are Immigrants from South Africa (2.3%, a difference of 0.040%), Czech (2.3%, a difference of 0.080%), Immigrants from Pakistan (2.3%, a difference of 0.090%), Immigrants from Uganda (2.3%, a difference of 0.13%), and Immigrants from Sudan (2.3%, a difference of 0.23%).
| Demographics | Rating | Rank | Self-Care Disability |
| Immigrants from Eastern Africa | 99.9 /100 | #38 | Exceptional 2.3% |
| Immigrants from Bulgaria | 99.8 /100 | #39 | Exceptional 2.3% |
| Iranians | 99.8 /100 | #40 | Exceptional 2.3% |
| Immigrants from Sudan | 99.8 /100 | #41 | Exceptional 2.3% |
| Immigrants from Uganda | 99.8 /100 | #42 | Exceptional 2.3% |
| Immigrants from Pakistan | 99.8 /100 | #43 | Exceptional 2.3% |
| Immigrants from South Africa | 99.8 /100 | #44 | Exceptional 2.3% |
| Norwegians | 99.8 /100 | #45 | Exceptional 2.3% |
| Czechs | 99.8 /100 | #46 | Exceptional 2.3% |
| Jordanians | 99.7 /100 | #47 | Exceptional 2.3% |
| Immigrants from Malaysia | 99.7 /100 | #48 | Exceptional 2.3% |
| Latvians | 99.7 /100 | #49 | Exceptional 2.3% |
| Immigrants from Brazil | 99.7 /100 | #50 | Exceptional 2.3% |
| Kenyans | 99.7 /100 | #51 | Exceptional 2.3% |
| Immigrants from Serbia | 99.6 /100 | #52 | Exceptional 2.3% |
Norwegian Self-Care Disability Correlation Summary
| Measurement | Norwegian Data | Self-Care Disability Data |
| Minimum | 0.25% | 0.64% |
| Maximum | 86.2% | 14.8% |
| Range | 86.0% | 14.2% |
| Mean | 33.9% | 2.6% |
| Median | 32.9% | 2.2% |
| Interquartile 25% (IQ1) | 16.2% | 1.9% |
| Interquartile 75% (IQ3) | 49.3% | 2.5% |
| Interquartile Range (IQR) | 33.1% | 0.60% |
| Standard Deviation (Sample) | 20.9% | 1.9% |
| Standard Deviation (Population) | 20.9% | 1.9% |
Correlation Details
| Norwegian Percentile | Sample Size | Self-Care Disability |
[ 0.0% - 0.5% ] 0.25% | 236,968,067 | 2.8% |
[ 0.5% - 1.0% ] 0.71% | 134,292,725 | 2.4% |
[ 1.0% - 1.5% ] 1.22% | 51,092,889 | 2.3% |
[ 1.5% - 2.0% ] 1.73% | 28,916,758 | 2.2% |
[ 2.0% - 2.5% ] 2.24% | 18,278,087 | 2.1% |
[ 2.5% - 3.0% ] 2.74% | 11,578,002 | 2.3% |
[ 3.0% - 3.5% ] 3.25% | 8,567,798 | 2.4% |
[ 3.5% - 4.0% ] 3.77% | 7,380,851 | 2.3% |
[ 4.0% - 4.5% ] 4.24% | 5,117,819 | 2.4% |
[ 4.5% - 5.0% ] 4.73% | 3,728,153 | 2.5% |
[ 5.0% - 5.5% ] 5.24% | 2,229,726 | 2.5% |
[ 5.5% - 6.0% ] 5.77% | 2,164,177 | 2.3% |
[ 6.0% - 6.5% ] 6.29% | 1,840,969 | 2.3% |
[ 6.5% - 7.0% ] 6.80% | 1,759,653 | 2.5% |
[ 7.0% - 7.5% ] 7.28% | 1,063,886 | 2.3% |
[ 7.5% - 8.0% ] 7.72% | 1,108,978 | 2.4% |
[ 8.0% - 8.5% ] 8.24% | 673,452 | 2.3% |
[ 8.5% - 9.0% ] 8.79% | 670,924 | 2.1% |
[ 9.0% - 9.5% ] 9.24% | 991,322 | 2.4% |
[ 9.5% - 10.0% ] 9.75% | 936,338 | 2.4% |
[ 10.0% - 10.5% ] 10.27% | 664,320 | 2.2% |
[ 10.5% - 11.0% ] 10.76% | 991,274 | 1.9% |
[ 11.0% - 11.5% ] 11.23% | 993,341 | 2.0% |
[ 11.5% - 12.0% ] 11.75% | 1,038,484 | 2.0% |
[ 12.0% - 12.5% ] 12.27% | 1,084,181 | 1.9% |
[ 12.5% - 13.0% ] 12.74% | 638,473 | 2.2% |
[ 13.0% - 13.5% ] 13.22% | 823,975 | 1.8% |
[ 13.5% - 14.0% ] 13.72% | 589,410 | 2.0% |
[ 14.0% - 14.5% ] 14.27% | 552,902 | 2.0% |
[ 14.5% - 15.0% ] 14.74% | 504,973 | 1.9% |
[ 15.0% - 15.5% ] 15.24% | 429,132 | 2.1% |
[ 15.5% - 16.0% ] 15.75% | 417,118 | 1.9% |
[ 16.0% - 16.5% ] 16.22% | 232,180 | 1.9% |
[ 16.5% - 17.0% ] 16.72% | 357,306 | 2.2% |
[ 17.0% - 17.5% ] 17.19% | 204,990 | 2.4% |
[ 17.5% - 18.0% ] 17.79% | 168,447 | 2.5% |
[ 18.0% - 18.5% ] 18.26% | 164,934 | 2.1% |
[ 18.5% - 19.0% ] 18.74% | 108,766 | 2.2% |
[ 19.0% - 19.5% ] 19.22% | 91,497 | 2.3% |
[ 19.5% - 20.0% ] 19.74% | 77,767 | 2.3% |
[ 20.0% - 20.5% ] 20.24% | 179,063 | 2.0% |
[ 20.5% - 21.0% ] 20.72% | 59,944 | 1.9% |
[ 21.0% - 21.5% ] 21.23% | 101,287 | 2.0% |
[ 21.5% - 22.0% ] 21.74% | 76,967 | 2.4% |
[ 22.0% - 22.5% ] 22.34% | 76,880 | 1.9% |
[ 22.5% - 23.0% ] 22.81% | 85,645 | 2.3% |
[ 23.0% - 23.5% ] 23.22% | 44,585 | 2.5% |
[ 23.5% - 24.0% ] 23.85% | 87,563 | 2.2% |
[ 24.0% - 24.5% ] 24.29% | 23,498 | 2.0% |
[ 24.5% - 25.0% ] 24.84% | 52,010 | 2.3% |
[ 25.0% - 25.5% ] 25.35% | 48,665 | 1.9% |
[ 25.5% - 26.0% ] 25.63% | 209,913 | 1.7% |
[ 26.0% - 26.5% ] 26.22% | 136,566 | 1.8% |
[ 26.5% - 27.0% ] 26.61% | 45,425 | 3.1% |
[ 27.0% - 27.5% ] 27.20% | 155,506 | 1.6% |
[ 27.5% - 28.0% ] 27.63% | 65,871 | 2.7% |
[ 28.0% - 28.5% ] 28.23% | 21,954 | 3.2% |
[ 28.5% - 29.0% ] 28.79% | 101,687 | 1.1% |
[ 29.0% - 29.5% ] 29.22% | 45,122 | 2.0% |
[ 29.5% - 30.0% ] 29.73% | 31,822 | 3.3% |
[ 30.0% - 30.5% ] 30.31% | 30,049 | 2.3% |
[ 30.5% - 31.0% ] 30.70% | 14,821 | 2.4% |
[ 31.0% - 31.5% ] 31.35% | 16,875 | 1.8% |
[ 31.5% - 32.0% ] 31.81% | 13,280 | 2.3% |
[ 32.0% - 32.5% ] 32.26% | 11,844 | 1.5% |
[ 32.5% - 33.0% ] 32.86% | 35,387 | 2.2% |
[ 33.0% - 33.5% ] 33.26% | 31,787 | 2.5% |
[ 33.5% - 34.0% ] 33.82% | 7,378 | 1.8% |
[ 34.0% - 34.5% ] 34.17% | 23,679 | 3.1% |
[ 34.5% - 35.0% ] 34.66% | 12,959 | 2.2% |
[ 35.0% - 35.5% ] 35.26% | 20,208 | 2.3% |
[ 35.5% - 36.0% ] 35.75% | 19,986 | 1.3% |
[ 36.0% - 36.5% ] 36.12% | 34,721 | 2.1% |
[ 36.5% - 37.0% ] 36.76% | 13,996 | 2.1% |
[ 37.0% - 37.5% ] 37.18% | 6,975 | 1.3% |
[ 37.5% - 38.0% ] 37.72% | 10,693 | 2.2% |
[ 38.0% - 38.5% ] 38.22% | 11,148 | 2.0% |
[ 38.5% - 39.0% ] 38.73% | 9,902 | 3.1% |
[ 39.0% - 39.5% ] 39.26% | 7,142 | 2.3% |
[ 39.5% - 40.0% ] 39.69% | 5,646 | 3.0% |
[ 40.0% - 40.5% ] 40.21% | 4,310 | 2.4% |
[ 40.5% - 41.0% ] 40.64% | 9,977 | 2.0% |
[ 41.0% - 41.5% ] 41.18% | 5,784 | 1.9% |
[ 41.5% - 42.0% ] 41.68% | 4,705 | 1.4% |
[ 42.0% - 42.5% ] 42.41% | 9,345 | 2.0% |
[ 42.5% - 43.0% ] 42.74% | 7,971 | 1.3% |
[ 43.0% - 43.5% ] 43.22% | 2,929 | 2.5% |
[ 43.5% - 44.0% ] 43.77% | 3,194 | 1.6% |
[ 44.0% - 44.5% ] 44.29% | 2,138 | 2.2% |
[ 44.5% - 45.0% ] 44.84% | 4,924 | 1.7% |
[ 45.0% - 45.5% ] 45.36% | 3,144 | 0.90% |
[ 45.5% - 46.0% ] 45.85% | 5,692 | 3.1% |
[ 46.0% - 46.5% ] 46.30% | 2,557 | 5.1% |
[ 46.5% - 47.0% ] 46.94% | 865 | 2.7% |
[ 47.0% - 47.5% ] 47.14% | 3,390 | 1.5% |
[ 47.5% - 48.0% ] 47.67% | 3,136 | 1.3% |
[ 48.0% - 48.5% ] 48.30% | 4,983 | 1.7% |
[ 48.5% - 49.0% ] 48.66% | 3,925 | 3.1% |
[ 49.0% - 49.5% ] 49.29% | 1,911 | 1.3% |
[ 49.5% - 50.0% ] 49.75% | 1,578 | 2.3% |
[ 50.0% - 50.5% ] 50.30% | 2,793 | 0.99% |
[ 50.5% - 51.0% ] 50.67% | 3,349 | 2.1% |
[ 51.0% - 51.5% ] 51.18% | 551 | 3.2% |
[ 52.0% - 52.5% ] 52.16% | 1,386 | 2.0% |
[ 52.5% - 53.0% ] 52.90% | 310 | 14.8% |
[ 53.0% - 53.5% ] 53.36% | 2,442 | 2.5% |
[ 53.5% - 54.0% ] 53.72% | 2,833 | 1.9% |
[ 54.0% - 54.5% ] 54.12% | 2,086 | 3.7% |
[ 55.0% - 55.5% ] 55.47% | 2,650 | 3.2% |
[ 55.5% - 56.0% ] 55.61% | 962 | 4.2% |
[ 56.0% - 56.5% ] 56.39% | 438 | 2.1% |
[ 56.5% - 57.0% ] 56.76% | 895 | 3.1% |
[ 57.0% - 57.5% ] 57.14% | 168 | 0.64% |
[ 57.5% - 58.0% ] 57.58% | 132 | 4.2% |
[ 58.5% - 59.0% ] 58.61% | 389 | 1.3% |
[ 60.0% - 60.5% ] 60.38% | 53 | 5.7% |
[ 60.5% - 61.0% ] 60.61% | 33 | 3.0% |
[ 63.0% - 63.5% ] 63.32% | 698 | 2.2% |
[ 63.5% - 64.0% ] 63.85% | 213 | 9.4% |
[ 64.0% - 64.5% ] 64.08% | 373 | 1.4% |
[ 64.5% - 65.0% ] 64.95% | 97 | 1.1% |
[ 65.5% - 66.0% ] 65.71% | 280 | 3.2% |
[ 68.0% - 68.5% ] 68.11% | 370 | 2.4% |
[ 69.0% - 69.5% ] 69.23% | 104 | 3.9% |
[ 69.5% - 70.0% ] 69.86% | 146 | 4.9% |
[ 72.0% - 72.5% ] 72.04% | 279 | 1.5% |
[ 76.5% - 77.0% ] 76.74% | 258 | 9.1% |
[ 77.5% - 78.0% ] 77.55% | 49 | 14.3% |
[ 78.0% - 78.5% ] 78.09% | 251 | 1.1% |
[ 80.5% - 81.0% ] 80.70% | 114 | 1.3% |
[ 86.0% - 86.5% ] 86.21% | 29 | 3.4% |