Norwegian Disability
COMPARE
Norwegian
Select to Compare
Disability
Norwegian Disability
12.2%
DISABILITY
1.9/ 100
METRIC RATING
238th/ 347
METRIC RANK
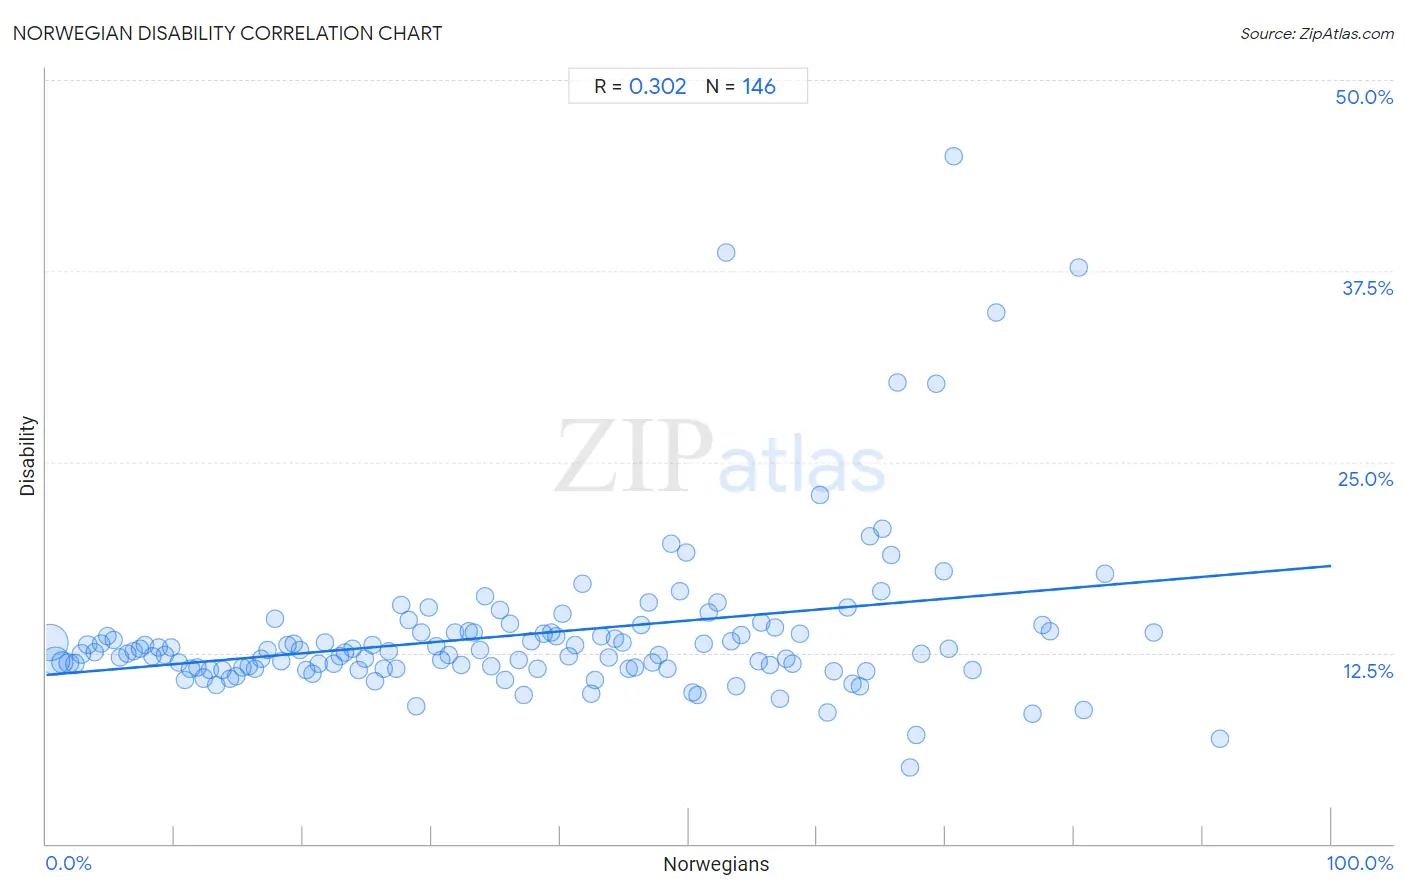
Norwegian Disability Correlation Chart
The statistical analysis conducted on geographies consisting of 533,272,047 people shows a mild positive correlation between the proportion of Norwegians and percentage of population with a disability in the United States with a correlation coefficient (R) of 0.302 and weighted average of 12.2%. On average, for every 1% (one percent) increase in Norwegians within a typical geography, there is an increase of 0.071% in percentage of population with a disability.
It is essential to understand that the correlation between the percentage of Norwegians and percentage of population with a disability does not imply a direct cause-and-effect relationship. It remains uncertain whether the presence of Norwegians influences an upward or downward trend in the level of percentage of population with a disability within an area, or if Norwegians simply ended up residing in those areas with higher or lower levels of percentage of population with a disability due to other factors.
Demographics Similar to Norwegians by Disability
In terms of disability, the demographic groups most similar to Norwegians are Immigrants from Congo (12.2%, a difference of 0.040%), Swedish (12.2%, a difference of 0.040%), Chinese (12.2%, a difference of 0.090%), Hungarian (12.2%, a difference of 0.090%), and Yugoslavian (12.2%, a difference of 0.090%).
| Demographics | Rating | Rank | Disability |
| Malaysians | 2.5 /100 | #231 | Tragic 12.2% |
| Italians | 2.5 /100 | #232 | Tragic 12.2% |
| Bahamians | 2.3 /100 | #233 | Tragic 12.2% |
| Japanese | 2.3 /100 | #234 | Tragic 12.2% |
| Yup'ik | 2.2 /100 | #235 | Tragic 12.2% |
| Chinese | 2.0 /100 | #236 | Tragic 12.2% |
| Immigrants from Congo | 1.9 /100 | #237 | Tragic 12.2% |
| Norwegians | 1.9 /100 | #238 | Tragic 12.2% |
| Swedes | 1.8 /100 | #239 | Tragic 12.2% |
| Hungarians | 1.7 /100 | #240 | Tragic 12.2% |
| Yugoslavians | 1.7 /100 | #241 | Tragic 12.2% |
| Poles | 1.7 /100 | #242 | Tragic 12.2% |
| British | 1.5 /100 | #243 | Tragic 12.2% |
| Basques | 1.5 /100 | #244 | Tragic 12.2% |
| Liberians | 1.5 /100 | #245 | Tragic 12.2% |
Norwegian Disability Correlation Summary
| Measurement | Norwegian Data | Disability Data |
| Minimum | 0.25% | 5.0% |
| Maximum | 91.4% | 45.0% |
| Range | 91.1% | 40.0% |
| Mean | 37.5% | 13.7% |
| Median | 36.4% | 12.5% |
| Interquartile 25% (IQ1) | 18.3% | 11.5% |
| Interquartile 75% (IQ3) | 55.5% | 13.8% |
| Interquartile Range (IQR) | 37.2% | 2.3% |
| Standard Deviation (Sample) | 22.7% | 5.4% |
| Standard Deviation (Population) | 22.6% | 5.3% |
Correlation Details
| Norwegian Percentile | Sample Size | Disability |
[ 0.0% - 0.5% ] 0.25% | 237,233,715 | 13.1% |
[ 0.5% - 1.0% ] 0.71% | 134,606,172 | 12.0% |
[ 1.0% - 1.5% ] 1.22% | 51,321,503 | 11.9% |
[ 1.5% - 2.0% ] 1.73% | 29,063,281 | 11.8% |
[ 2.0% - 2.5% ] 2.24% | 18,396,029 | 11.8% |
[ 2.5% - 3.0% ] 2.74% | 11,669,301 | 12.4% |
[ 3.0% - 3.5% ] 3.25% | 8,636,804 | 13.0% |
[ 3.5% - 4.0% ] 3.77% | 7,438,416 | 12.5% |
[ 4.0% - 4.5% ] 4.24% | 5,156,449 | 13.1% |
[ 4.5% - 5.0% ] 4.73% | 3,756,649 | 13.6% |
[ 5.0% - 5.5% ] 5.24% | 2,252,591 | 13.4% |
[ 5.5% - 6.0% ] 5.77% | 2,197,232 | 12.2% |
[ 6.0% - 6.5% ] 6.29% | 1,872,647 | 12.4% |
[ 6.5% - 7.0% ] 6.80% | 1,785,310 | 12.6% |
[ 7.0% - 7.5% ] 7.28% | 1,077,253 | 12.8% |
[ 7.5% - 8.0% ] 7.72% | 1,125,258 | 13.0% |
[ 8.0% - 8.5% ] 8.24% | 688,861 | 12.3% |
[ 8.5% - 9.0% ] 8.79% | 675,937 | 12.9% |
[ 9.0% - 9.5% ] 9.25% | 1,002,518 | 12.4% |
[ 9.5% - 10.0% ] 9.75% | 941,020 | 12.9% |
[ 10.0% - 10.5% ] 10.27% | 671,396 | 11.9% |
[ 10.5% - 11.0% ] 10.76% | 999,588 | 10.7% |
[ 11.0% - 11.5% ] 11.23% | 998,339 | 11.5% |
[ 11.5% - 12.0% ] 11.75% | 1,041,579 | 11.5% |
[ 12.0% - 12.5% ] 12.27% | 1,086,919 | 10.8% |
[ 12.5% - 13.0% ] 12.74% | 641,576 | 11.4% |
[ 13.0% - 13.5% ] 13.22% | 845,236 | 10.4% |
[ 13.5% - 14.0% ] 13.72% | 593,573 | 11.4% |
[ 14.0% - 14.5% ] 14.27% | 554,642 | 10.8% |
[ 14.5% - 15.0% ] 14.74% | 508,572 | 10.9% |
[ 15.0% - 15.5% ] 15.24% | 431,728 | 11.5% |
[ 15.5% - 16.0% ] 15.75% | 424,360 | 11.6% |
[ 16.0% - 16.5% ] 16.22% | 232,952 | 11.4% |
[ 16.5% - 17.0% ] 16.72% | 358,451 | 12.1% |
[ 17.0% - 17.5% ] 17.19% | 208,835 | 12.7% |
[ 17.5% - 18.0% ] 17.79% | 169,932 | 14.8% |
[ 18.0% - 18.5% ] 18.26% | 167,927 | 11.9% |
[ 18.5% - 19.0% ] 18.74% | 109,270 | 13.0% |
[ 19.0% - 19.5% ] 19.22% | 92,823 | 13.1% |
[ 19.5% - 20.0% ] 19.75% | 79,802 | 12.7% |
[ 20.0% - 20.5% ] 20.24% | 179,942 | 11.4% |
[ 20.5% - 21.0% ] 20.72% | 62,028 | 11.1% |
[ 21.0% - 21.5% ] 21.24% | 106,729 | 11.8% |
[ 21.5% - 22.0% ] 21.74% | 77,751 | 13.2% |
[ 22.0% - 22.5% ] 22.34% | 78,522 | 11.8% |
[ 22.5% - 23.0% ] 22.81% | 85,998 | 12.3% |
[ 23.0% - 23.5% ] 23.22% | 45,850 | 12.5% |
[ 23.5% - 24.0% ] 23.85% | 89,349 | 12.8% |
[ 24.0% - 24.5% ] 24.30% | 27,926 | 11.4% |
[ 24.5% - 25.0% ] 24.83% | 57,347 | 12.1% |
[ 25.0% - 25.5% ] 25.35% | 50,292 | 13.0% |
[ 25.5% - 26.0% ] 25.63% | 211,249 | 10.6% |
[ 26.0% - 26.5% ] 26.22% | 137,267 | 11.5% |
[ 26.5% - 27.0% ] 26.61% | 46,115 | 12.6% |
[ 27.0% - 27.5% ] 27.20% | 157,049 | 11.5% |
[ 27.5% - 28.0% ] 27.63% | 66,550 | 15.6% |
[ 28.0% - 28.5% ] 28.24% | 23,196 | 14.6% |
[ 28.5% - 29.0% ] 28.79% | 101,920 | 9.0% |
[ 29.0% - 29.5% ] 29.21% | 46,429 | 13.8% |
[ 29.5% - 30.0% ] 29.73% | 32,438 | 15.5% |
[ 30.0% - 30.5% ] 30.31% | 30,591 | 12.9% |
[ 30.5% - 31.0% ] 30.72% | 16,708 | 12.0% |
[ 31.0% - 31.5% ] 31.35% | 16,920 | 12.3% |
[ 31.5% - 32.0% ] 31.81% | 13,947 | 13.8% |
[ 32.0% - 32.5% ] 32.26% | 12,197 | 11.7% |
[ 32.5% - 33.0% ] 32.85% | 36,337 | 13.9% |
[ 33.0% - 33.5% ] 33.26% | 32,358 | 13.8% |
[ 33.5% - 34.0% ] 33.79% | 9,159 | 12.7% |
[ 34.0% - 34.5% ] 34.18% | 25,603 | 16.2% |
[ 34.5% - 35.0% ] 34.66% | 13,498 | 11.7% |
[ 35.0% - 35.5% ] 35.26% | 20,959 | 15.3% |
[ 35.5% - 36.0% ] 35.74% | 21,141 | 10.7% |
[ 36.0% - 36.5% ] 36.12% | 35,416 | 14.4% |
[ 36.5% - 37.0% ] 36.76% | 14,430 | 12.0% |
[ 37.0% - 37.5% ] 37.18% | 7,464 | 9.7% |
[ 37.5% - 38.0% ] 37.72% | 11,289 | 13.3% |
[ 38.0% - 38.5% ] 38.22% | 11,245 | 11.5% |
[ 38.5% - 39.0% ] 38.73% | 9,972 | 13.7% |
[ 39.0% - 39.5% ] 39.26% | 7,499 | 13.8% |
[ 39.5% - 40.0% ] 39.69% | 5,795 | 13.6% |
[ 40.0% - 40.5% ] 40.21% | 4,479 | 15.0% |
[ 40.5% - 41.0% ] 40.64% | 10,233 | 12.3% |
[ 41.0% - 41.5% ] 41.19% | 6,043 | 13.0% |
[ 41.5% - 42.0% ] 41.69% | 5,088 | 17.0% |
[ 42.0% - 42.5% ] 42.41% | 9,411 | 9.9% |
[ 42.5% - 43.0% ] 42.74% | 8,530 | 10.7% |
[ 43.0% - 43.5% ] 43.22% | 3,306 | 13.6% |
[ 43.5% - 44.0% ] 43.77% | 3,356 | 12.2% |
[ 44.0% - 44.5% ] 44.29% | 2,371 | 13.4% |
[ 44.5% - 45.0% ] 44.85% | 5,342 | 13.1% |
[ 45.0% - 45.5% ] 45.35% | 3,259 | 11.4% |
[ 45.5% - 46.0% ] 45.85% | 5,786 | 11.5% |
[ 46.0% - 46.5% ] 46.30% | 3,004 | 14.3% |
[ 46.5% - 47.0% ] 46.93% | 929 | 15.8% |
[ 47.0% - 47.5% ] 47.15% | 3,680 | 11.9% |
[ 47.5% - 48.0% ] 47.68% | 3,205 | 12.4% |
[ 48.0% - 48.5% ] 48.30% | 5,186 | 11.4% |
[ 48.5% - 49.0% ] 48.67% | 4,089 | 19.7% |
[ 49.0% - 49.5% ] 49.30% | 2,215 | 16.5% |
[ 49.5% - 50.0% ] 49.78% | 2,069 | 19.0% |
[ 50.0% - 50.5% ] 50.30% | 2,793 | 9.9% |
[ 50.5% - 51.0% ] 50.68% | 3,623 | 9.8% |
[ 51.0% - 51.5% ] 51.18% | 551 | 13.1% |
[ 51.5% - 52.0% ] 51.60% | 312 | 15.1% |
[ 52.0% - 52.5% ] 52.19% | 1,734 | 15.8% |
[ 52.5% - 53.0% ] 52.90% | 431 | 38.7% |
[ 53.0% - 53.5% ] 53.35% | 2,656 | 13.3% |
[ 53.5% - 54.0% ] 53.72% | 3,027 | 10.3% |
[ 54.0% - 54.5% ] 54.12% | 2,086 | 13.7% |
[ 55.0% - 55.5% ] 55.47% | 2,650 | 12.0% |
[ 55.5% - 56.0% ] 55.61% | 962 | 14.5% |
[ 56.0% - 56.5% ] 56.36% | 495 | 11.7% |
[ 56.5% - 57.0% ] 56.73% | 1,188 | 14.2% |
[ 57.0% - 57.5% ] 57.14% | 168 | 9.5% |
[ 57.5% - 58.0% ] 57.58% | 132 | 12.1% |
[ 58.0% - 58.5% ] 58.07% | 508 | 11.8% |
[ 58.5% - 59.0% ] 58.63% | 539 | 13.7% |
[ 60.0% - 60.5% ] 60.17% | 241 | 22.8% |
[ 60.5% - 61.0% ] 60.77% | 209 | 8.6% |
[ 61.0% - 61.5% ] 61.32% | 106 | 11.3% |
[ 62.0% - 62.5% ] 62.35% | 162 | 15.4% |
[ 62.5% - 63.0% ] 62.79% | 86 | 10.5% |
[ 63.0% - 63.5% ] 63.32% | 698 | 10.3% |
[ 63.5% - 64.0% ] 63.85% | 213 | 11.3% |
[ 64.0% - 64.5% ] 64.08% | 373 | 20.1% |
[ 64.5% - 65.0% ] 64.95% | 97 | 16.5% |
[ 65.0% - 65.5% ] 65.08% | 315 | 20.6% |
[ 65.5% - 66.0% ] 65.71% | 280 | 18.9% |
[ 66.0% - 66.5% ] 66.24% | 391 | 30.2% |
[ 67.0% - 67.5% ] 67.22% | 180 | 5.0% |
[ 67.5% - 68.0% ] 67.74% | 155 | 7.1% |
[ 68.0% - 68.5% ] 68.11% | 370 | 12.4% |
[ 69.0% - 69.5% ] 69.23% | 104 | 30.1% |
[ 69.5% - 70.0% ] 69.86% | 146 | 17.8% |
[ 70.0% - 70.5% ] 70.21% | 47 | 12.8% |
[ 70.5% - 71.0% ] 70.61% | 313 | 45.0% |
[ 72.0% - 72.5% ] 72.08% | 308 | 11.4% |
[ 73.5% - 74.0% ] 73.91% | 46 | 34.8% |
[ 76.5% - 77.0% ] 76.75% | 271 | 8.5% |
[ 77.5% - 78.0% ] 77.55% | 49 | 14.3% |
[ 78.0% - 78.5% ] 78.09% | 251 | 13.9% |
[ 80.0% - 80.5% ] 80.33% | 61 | 37.7% |
[ 80.5% - 81.0% ] 80.70% | 114 | 8.8% |
[ 82.0% - 82.5% ] 82.35% | 17 | 17.6% |
[ 86.0% - 86.5% ] 86.21% | 29 | 13.8% |
[ 91.0% - 91.5% ] 91.38% | 58 | 6.9% |