Norwegian Unemployment Among Women with Children Ages 6 to 17 years
COMPARE
Norwegian
Select to Compare
Unemployment Among Women with Children Ages 6 to 17 years
Norwegian Unemployment Among Women with Children Ages 6 to 17 years
8.3%
UNEMPLOYMENT | WOMEN W/ CHILDREN 6 TO 17
99.9/ 100
METRIC RATING
70th/ 347
METRIC RANK
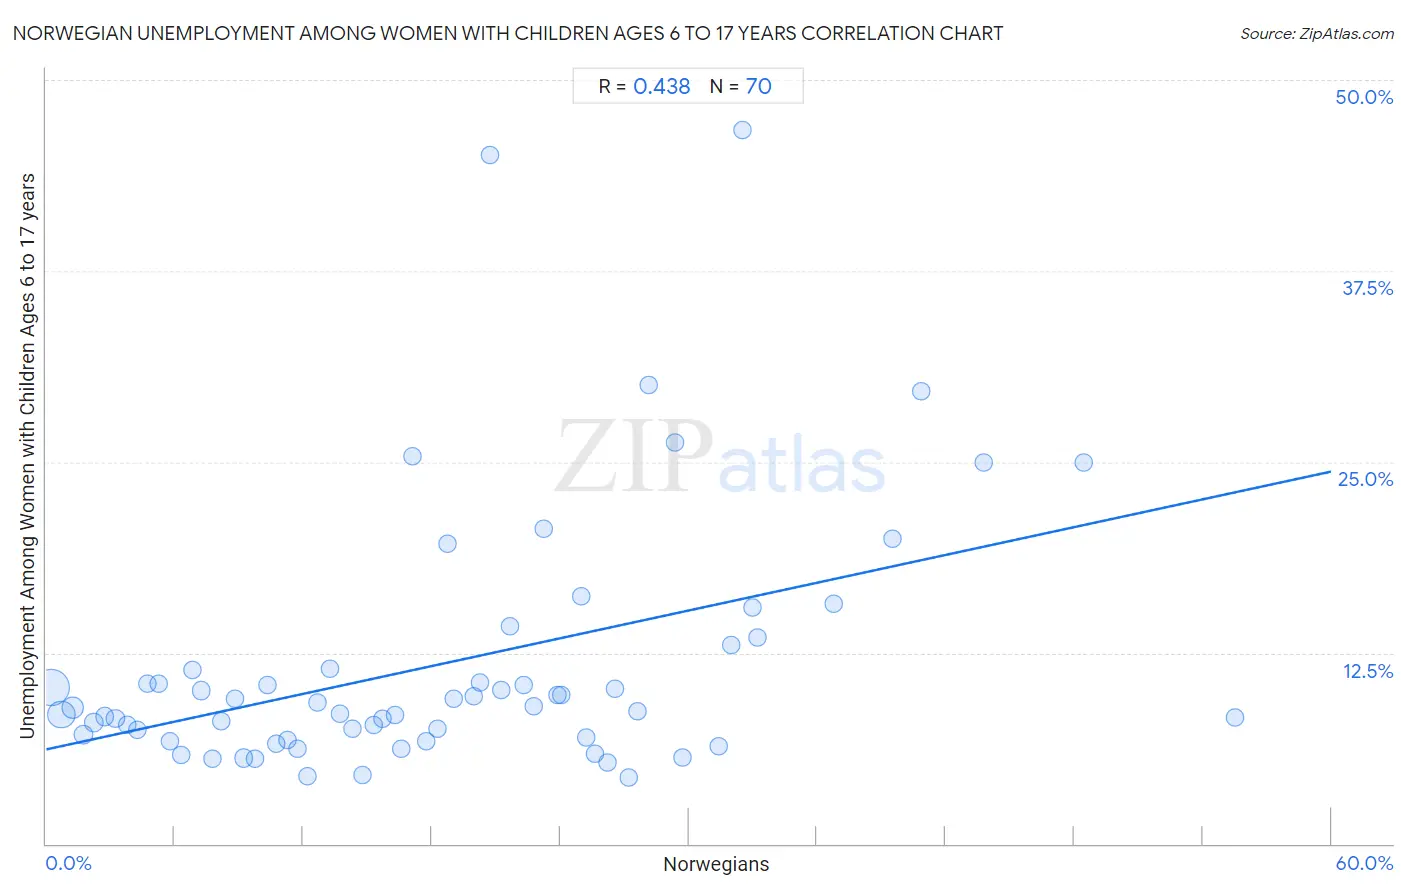
Norwegian Unemployment Among Women with Children Ages 6 to 17 years Correlation Chart
The statistical analysis conducted on geographies consisting of 341,583,618 people shows a moderate positive correlation between the proportion of Norwegians and unemployment rate among women with children between the ages 6 and 17 in the United States with a correlation coefficient (R) of 0.438 and weighted average of 8.3%. On average, for every 1% (one percent) increase in Norwegians within a typical geography, there is an increase of 0.30% in unemployment rate among women with children between the ages 6 and 17.
It is essential to understand that the correlation between the percentage of Norwegians and unemployment rate among women with children between the ages 6 and 17 does not imply a direct cause-and-effect relationship. It remains uncertain whether the presence of Norwegians influences an upward or downward trend in the level of unemployment rate among women with children between the ages 6 and 17 within an area, or if Norwegians simply ended up residing in those areas with higher or lower levels of unemployment rate among women with children between the ages 6 and 17 due to other factors.
Demographics Similar to Norwegians by Unemployment Among Women with Children Ages 6 to 17 years
In terms of unemployment among women with children ages 6 to 17 years, the demographic groups most similar to Norwegians are Immigrants from Australia (8.3%, a difference of 0.060%), Immigrants from Thailand (8.3%, a difference of 0.080%), Immigrants from Nepal (8.3%, a difference of 0.10%), Marshallese (8.3%, a difference of 0.11%), and Armenian (8.3%, a difference of 0.19%).
| Demographics | Rating | Rank | Unemployment Among Women with Children Ages 6 to 17 years |
| Immigrants from South Eastern Asia | 99.9 /100 | #63 | Exceptional 8.2% |
| Immigrants from Kuwait | 99.9 /100 | #64 | Exceptional 8.3% |
| Immigrants from Albania | 99.9 /100 | #65 | Exceptional 8.3% |
| Luxembourgers | 99.9 /100 | #66 | Exceptional 8.3% |
| Armenians | 99.9 /100 | #67 | Exceptional 8.3% |
| Marshallese | 99.9 /100 | #68 | Exceptional 8.3% |
| Immigrants from Thailand | 99.9 /100 | #69 | Exceptional 8.3% |
| Norwegians | 99.9 /100 | #70 | Exceptional 8.3% |
| Immigrants from Australia | 99.8 /100 | #71 | Exceptional 8.3% |
| Immigrants from Nepal | 99.8 /100 | #72 | Exceptional 8.3% |
| Spanish Americans | 99.8 /100 | #73 | Exceptional 8.4% |
| Samoans | 99.7 /100 | #74 | Exceptional 8.4% |
| Immigrants from Sri Lanka | 99.7 /100 | #75 | Exceptional 8.4% |
| Immigrants from Moldova | 99.7 /100 | #76 | Exceptional 8.4% |
| Iraqis | 99.7 /100 | #77 | Exceptional 8.4% |
Norwegian Unemployment Among Women with Children Ages 6 to 17 years Correlation Summary
| Measurement | Norwegian Data | Unemployment Among Women with Children Ages 6 to 17 years Data |
| Minimum | 0.25% | 4.3% |
| Maximum | 55.5% | 46.7% |
| Range | 55.3% | 42.4% |
| Mean | 18.5% | 11.8% |
| Median | 17.4% | 8.9% |
| Interquartile 25% (IQ1) | 8.8% | 6.9% |
| Interquartile 75% (IQ3) | 26.2% | 11.4% |
| Interquartile Range (IQR) | 17.4% | 4.5% |
| Standard Deviation (Sample) | 12.2% | 8.5% |
| Standard Deviation (Population) | 12.1% | 8.4% |
Correlation Details
| Norwegian Percentile | Sample Size | Unemployment Among Women with Children Ages 6 to 17 years |
[ 0.0% - 0.5% ] 0.25% | 168,038,349 | 10.3% |
[ 0.5% - 1.0% ] 0.71% | 87,061,281 | 8.5% |
[ 1.0% - 1.5% ] 1.22% | 29,960,493 | 8.9% |
[ 1.5% - 2.0% ] 1.73% | 16,707,451 | 7.1% |
[ 2.0% - 2.5% ] 2.25% | 10,102,004 | 7.9% |
[ 2.5% - 3.0% ] 2.74% | 5,894,965 | 8.3% |
[ 3.0% - 3.5% ] 3.24% | 4,539,524 | 8.2% |
[ 3.5% - 4.0% ] 3.77% | 3,990,537 | 7.8% |
[ 4.0% - 4.5% ] 4.24% | 2,570,470 | 7.4% |
[ 4.5% - 5.0% ] 4.74% | 1,703,252 | 10.5% |
[ 5.0% - 5.5% ] 5.23% | 1,011,617 | 10.4% |
[ 5.5% - 6.0% ] 5.76% | 966,339 | 6.7% |
[ 6.0% - 6.5% ] 6.33% | 876,507 | 5.8% |
[ 6.5% - 7.0% ] 6.83% | 992,384 | 11.4% |
[ 7.0% - 7.5% ] 7.24% | 338,258 | 10.0% |
[ 7.5% - 8.0% ] 7.74% | 434,580 | 5.5% |
[ 8.0% - 8.5% ] 8.16% | 144,652 | 8.0% |
[ 8.5% - 9.0% ] 8.80% | 278,061 | 9.5% |
[ 9.0% - 9.5% ] 9.24% | 676,048 | 5.6% |
[ 9.5% - 10.0% ] 9.76% | 571,648 | 5.6% |
[ 10.0% - 10.5% ] 10.33% | 241,169 | 10.4% |
[ 10.5% - 11.0% ] 10.76% | 567,079 | 6.5% |
[ 11.0% - 11.5% ] 11.24% | 562,006 | 6.8% |
[ 11.5% - 12.0% ] 11.75% | 488,204 | 6.2% |
[ 12.0% - 12.5% ] 12.19% | 410,033 | 4.4% |
[ 12.5% - 13.0% ] 12.69% | 143,842 | 9.2% |
[ 13.0% - 13.5% ] 13.23% | 326,101 | 11.4% |
[ 13.5% - 14.0% ] 13.69% | 290,038 | 8.5% |
[ 14.0% - 14.5% ] 14.30% | 281,885 | 7.5% |
[ 14.5% - 15.0% ] 14.75% | 135,389 | 4.5% |
[ 15.0% - 15.5% ] 15.31% | 59,012 | 7.8% |
[ 15.5% - 16.0% ] 15.68% | 96,231 | 8.2% |
[ 16.0% - 16.5% ] 16.29% | 98,543 | 8.4% |
[ 16.5% - 17.0% ] 16.60% | 126,344 | 6.2% |
[ 17.0% - 17.5% ] 17.13% | 13,371 | 25.3% |
[ 17.5% - 18.0% ] 17.75% | 20,032 | 6.7% |
[ 18.0% - 18.5% ] 18.24% | 66,685 | 7.5% |
[ 18.5% - 19.0% ] 18.76% | 14,004 | 19.7% |
[ 19.0% - 19.5% ] 19.06% | 5,253 | 9.5% |
[ 19.5% - 20.0% ] 19.94% | 5,215 | 9.6% |
[ 20.0% - 20.5% ] 20.26% | 121,148 | 10.5% |
[ 20.5% - 21.0% ] 20.73% | 1,404 | 45.1% |
[ 21.0% - 21.5% ] 21.22% | 27,734 | 10.1% |
[ 21.5% - 22.0% ] 21.68% | 21,732 | 14.2% |
[ 22.0% - 22.5% ] 22.27% | 12,107 | 10.4% |
[ 22.5% - 23.0% ] 22.77% | 21,635 | 9.0% |
[ 23.0% - 23.5% ] 23.22% | 10,708 | 20.6% |
[ 23.5% - 24.0% ] 23.90% | 57,552 | 9.7% |
[ 24.0% - 24.5% ] 24.04% | 1,743 | 9.7% |
[ 24.5% - 25.0% ] 24.97% | 3,528 | 16.2% |
[ 25.0% - 25.5% ] 25.21% | 3,431 | 6.9% |
[ 25.5% - 26.0% ] 25.61% | 186,254 | 5.9% |
[ 26.0% - 26.5% ] 26.22% | 104,873 | 5.3% |
[ 26.5% - 27.0% ] 26.57% | 36,070 | 10.2% |
[ 27.0% - 27.5% ] 27.22% | 86,213 | 4.3% |
[ 27.5% - 28.0% ] 27.60% | 17,596 | 8.7% |
[ 28.0% - 28.5% ] 28.11% | 587 | 30.0% |
[ 29.0% - 29.5% ] 29.37% | 463 | 26.3% |
[ 29.5% - 30.0% ] 29.72% | 20,110 | 5.6% |
[ 31.0% - 31.5% ] 31.40% | 8,722 | 6.4% |
[ 31.5% - 32.0% ] 31.98% | 3,696 | 13.0% |
[ 32.0% - 32.5% ] 32.48% | 1,493 | 46.7% |
[ 32.5% - 33.0% ] 32.98% | 9,311 | 15.4% |
[ 33.0% - 33.5% ] 33.20% | 10,905 | 13.5% |
[ 36.5% - 37.0% ] 36.78% | 2,760 | 15.7% |
[ 39.0% - 39.5% ] 39.49% | 395 | 20.0% |
[ 40.5% - 41.0% ] 40.87% | 1,363 | 29.6% |
[ 43.5% - 44.0% ] 43.77% | 562 | 25.0% |
[ 48.0% - 48.5% ] 48.46% | 260 | 25.0% |
[ 55.5% - 56.0% ] 55.53% | 407 | 8.3% |