Luxembourger Female Disability

COMPARE

Luxembourger
Race
Ancestry
AfghanAfricanAlaska NativeAlaskan AthabascanAlbanianAleutAlsatianAmericanApacheArabArapahoArgentineanArmenianAssyrian/Chaldean/SyriacAustralianAustrianBahamianBangladeshiBarbadianBasqueBelgianBelizeanBermudanBhutaneseBlackfeetBolivianBrazilianBritishBritish West IndianBulgarianBurmeseCajunCambodianCanadianCape VerdeanCarpatho RusynCelticCentral AmericanCentral American IndianCherokeeCheyenneChickasawChileanChineseChippewaChoctawColombianColvilleComancheCosta RicanCreeCreekCroatianCrowCubanCypriotCzechCzechoslovakianDanishDelawareDominicanDutchDutch West IndianEastern EuropeanEcuadorianEgyptianEnglishEstonianEthiopianEuropeanFijianFilipinoFinnishFrenchFrench American IndianFrench CanadianGermanGerman RussianGhanaianGreekGuamanian/ChamorroGuatemalanGuyaneseHaitianHmongHonduranHopiHoumaHungarianIcelanderIndian (Asian)IndonesianInupiatIranianIraqiIrishIroquoisIsraeliItalianJamaicanJapaneseJordanianKenyanKiowaKoreanLaotianLatvianLebaneseLiberianLithuanianLumbeeLuxembourgerMacedonianMalaysianMalteseMarshalleseMenomineeMexicanMexican American IndianMongolianMoroccanNative HawaiianNavajoNepaleseNew ZealanderNicaraguanNigerianNorthern EuropeanNorwegianOkinawanOsageOttawaPaiutePakistaniPalestinianPanamanianParaguayanPennsylvania GermanPeruvianPimaPolishPortuguesePotawatomiPuebloPuerto RicanPuget Sound SalishRomanianRussianSalvadoranSamoanScandinavianScotch-IrishScottishSeminoleSenegaleseSerbianShoshoneSierra LeoneanSiouxSlavicSlovakSloveneSomaliSouth AfricanSouth AmericanSouth American IndianSoviet UnionSpaniardSpanishSpanish AmericanSpanish American IndianSri LankanSubsaharan AfricanSudaneseSwedishSwissSyrianTaiwaneseThaiTlingit-HaidaTohono O'OdhamTonganTrinidadian and TobagonianTsimshianTurkishU.S. Virgin IslanderUgandanUkrainianUruguayanUteVenezuelanVietnameseWelshWest IndianYakamaYaquiYugoslavianYumanYup'ikZimbabwean
Immigration
NonimmigrantsImmigrantsAfghanistanAfricaAlbaniaArgentinaArmeniaAsiaAustraliaAustriaBahamasBangladeshBarbadosBelarusBelgiumBelizeBoliviaBosnia and HerzegovinaBrazilBulgariaBurma/MyanmarCabo VerdeCambodiaCameroonCanadaCaribbeanCentral AmericaChileChinaColombiaCongoCosta RicaCroatiaCubaCzechoslovakiaDenmarkDominicaDominican RepublicEastern AfricaEastern AsiaEastern EuropeEcuadorEgyptEl SalvadorEnglandEritreaEthiopiaEuropeFijiFranceGermanyGhanaGreeceGrenadaGuatemalaGuyanaHaitiHondurasHong KongHungaryIndiaIndonesiaIranIraqIrelandIsraelItalyJamaicaJapanJordanKazakhstanKenyaKoreaKuwaitLaosLatin AmericaLatviaLebanonLiberiaLithuaniaMalaysiaMexicoMicronesiaMiddle AfricaMoldovaMoroccoNepalNetherlandsNicaraguaNigeriaNorth AmericaNorth MacedoniaNorthern AfricaNorthern EuropeNorwayOceaniaPakistanPanamaPeruPhilippinesPolandPortugalRomaniaRussiaSaudi ArabiaScotlandSenegalSerbiaSierra LeoneSingaporeSomaliaSouth AfricaSouth AmericaSouth Central AsiaSouth Eastern AsiaSouthern EuropeSpainSri LankaSt. Vincent and the GrenadinesSudanSwedenSwitzerlandSyriaTaiwanThailandTrinidad and TobagoTurkeyUgandaUkraineUruguayUzbekistanVenezuelaVietnamWest IndiesWestern AfricaWestern AsiaWestern EuropeYemenZaireZimbabweAzores
Select to Compare
Race
Ancestry
AfghanAfricanAlaska NativeAlaskan AthabascanAlbanianAleutAlsatianAmericanApacheArabArapahoArgentineanArmenianAssyrian/Chaldean/SyriacAustralianAustrianBahamianBangladeshiBarbadianBasqueBelgianBelizeanBermudanBhutaneseBlackfeetBolivianBrazilianBritishBritish West IndianBulgarianBurmeseCajunCambodianCanadianCape VerdeanCarpatho RusynCelticCentral AmericanCentral American IndianCherokeeCheyenneChickasawChileanChineseChippewaChoctawColombianColvilleComancheCosta RicanCreeCreekCroatianCrowCubanCypriotCzechCzechoslovakianDanishDelawareDominicanDutchDutch West IndianEastern EuropeanEcuadorianEgyptianEnglishEstonianEthiopianEuropeanFijianFilipinoFinnishFrenchFrench American IndianFrench CanadianGermanGerman RussianGhanaianGreekGuamanian/ChamorroGuatemalanGuyaneseHaitianHmongHonduranHopiHoumaHungarianIcelanderIndian (Asian)IndonesianInupiatIranianIraqiIrishIroquoisIsraeliItalianJamaicanJapaneseJordanianKenyanKiowaKoreanLaotianLatvianLebaneseLiberianLithuanianLumbeeMacedonianMalaysianMalteseMarshalleseMenomineeMexicanMexican American IndianMongolianMoroccanNative HawaiianNavajoNepaleseNew ZealanderNicaraguanNigerianNorthern EuropeanNorwegianOkinawanOsageOttawaPaiutePakistaniPalestinianPanamanianParaguayanPennsylvania GermanPeruvianPimaPolishPortuguesePotawatomiPuebloPuerto RicanPuget Sound SalishRomanianRussianSalvadoranSamoanScandinavianScotch-IrishScottishSeminoleSenegaleseSerbianShoshoneSierra LeoneanSiouxSlavicSlovakSloveneSomaliSouth AfricanSouth AmericanSouth American IndianSoviet UnionSpaniardSpanishSpanish AmericanSpanish American IndianSri LankanSubsaharan AfricanSudaneseSwedishSwissSyrianTaiwaneseThaiTlingit-HaidaTohono O'OdhamTonganTrinidadian and TobagonianTsimshianTurkishU.S. Virgin IslanderUgandanUkrainianUruguayanUteVenezuelanVietnameseWelshWest IndianYakamaYaquiYugoslavianYumanYup'ikZimbabwean
Immigration
NonimmigrantsImmigrantsAfghanistanAfricaAlbaniaArgentinaArmeniaAsiaAustraliaAustriaBahamasBangladeshBarbadosBelarusBelgiumBelizeBoliviaBosnia and HerzegovinaBrazilBulgariaBurma/MyanmarCabo VerdeCambodiaCameroonCanadaCaribbeanCentral AmericaChileChinaColombiaCongoCosta RicaCroatiaCubaCzechoslovakiaDenmarkDominicaDominican RepublicEastern AfricaEastern AsiaEastern EuropeEcuadorEgyptEl SalvadorEnglandEritreaEthiopiaEuropeFijiFranceGermanyGhanaGreeceGrenadaGuatemalaGuyanaHaitiHondurasHong KongHungaryIndiaIndonesiaIranIraqIrelandIsraelItalyJamaicaJapanJordanKazakhstanKenyaKoreaKuwaitLaosLatin AmericaLatviaLebanonLiberiaLithuaniaMalaysiaMexicoMicronesiaMiddle AfricaMoldovaMoroccoNepalNetherlandsNicaraguaNigeriaNorth AmericaNorth MacedoniaNorthern AfricaNorthern EuropeNorwayOceaniaPakistanPanamaPeruPhilippinesPolandPortugalRomaniaRussiaSaudi ArabiaScotlandSenegalSerbiaSierra LeoneSingaporeSomaliaSouth AfricaSouth AmericaSouth Central AsiaSouth Eastern AsiaSouthern EuropeSpainSri LankaSt. Vincent and the GrenadinesSudanSwedenSwitzerlandSyriaTaiwanThailandTrinidad and TobagoTurkeyUgandaUkraineUruguayUzbekistanVenezuelaVietnamWest IndiesWestern AfricaWestern AsiaWestern EuropeYemenZaireZimbabweAzores
Female Disability
Income
Poverty
Unemployment
Labor Participation
Family Structure
Vehicle Availability
Education Level
Disability

Luxembourger Female Disability
Exceptional

11.6%
DISABILITY | FEMALES
99.6/ 100
METRIC RATING
82nd/ 347
METRIC RANK

Luxembourger Female Disability Correlation Chart

The statistical analysis conducted on geographies consisting of 144,677,023 people shows a poor negative correlation between the proportion of Luxembourgers and percentage of females with a disability in the United States with a correlation coefficient (R) of -0.106 and weighted average of 11.6%. On average, for every 1% (one percent) increase in Luxembourgers within a typical geography, there is a decrease of 0.065% in percentage of females with a disability.
Luxembourger Female Disability
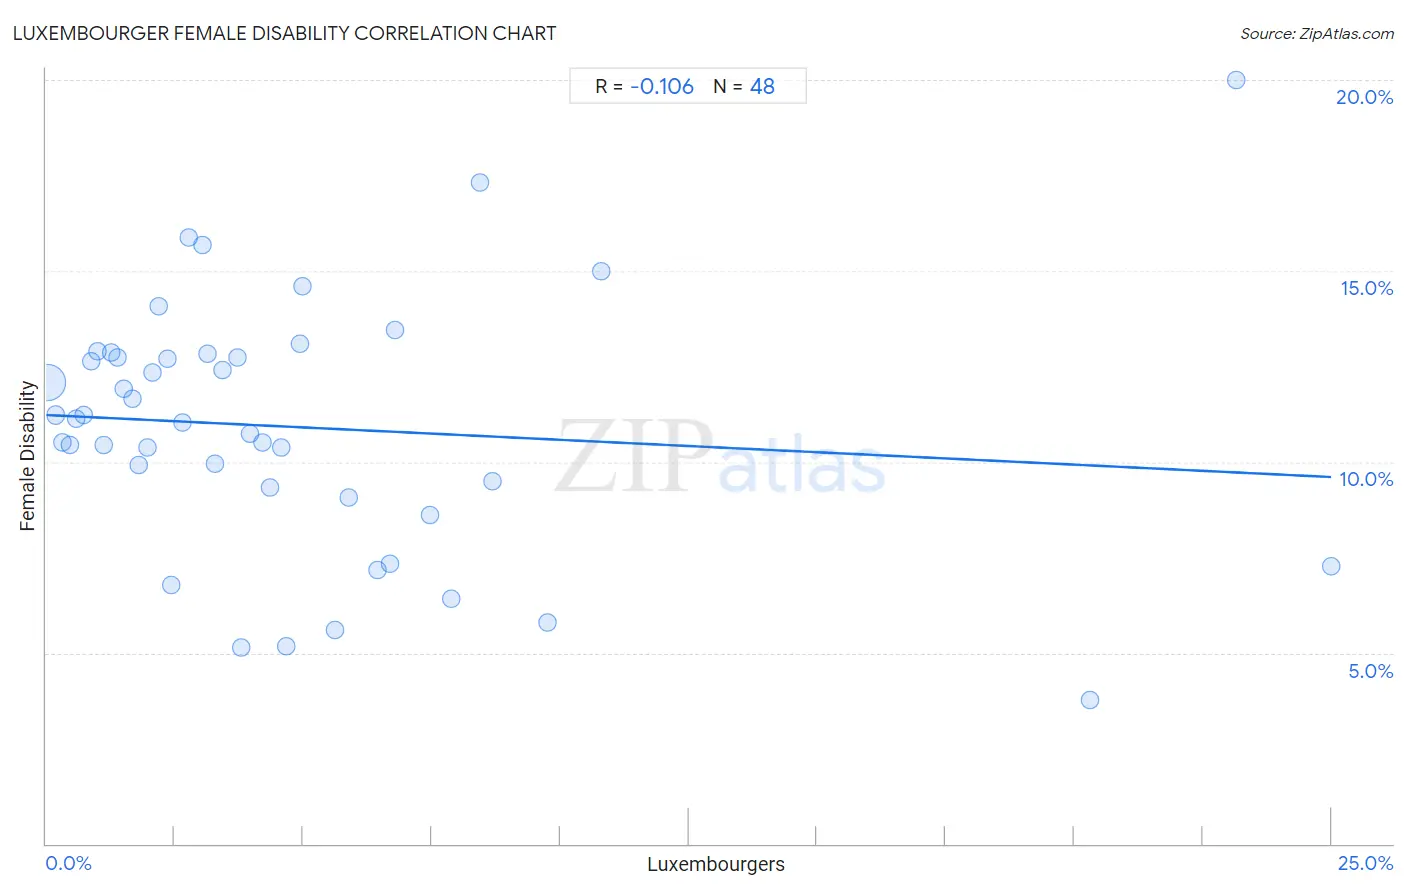
It is essential to understand that the correlation between the percentage of Luxembourgers and percentage of females with a disability does not imply a direct cause-and-effect relationship. It remains uncertain whether the presence of Luxembourgers influences an upward or downward trend in the level of percentage of females with a disability within an area, or if Luxembourgers simply ended up residing in those areas with higher or lower levels of percentage of females with a disability due to other factors.

Demographics Similar to Luxembourgers by Female Disability

In terms of female disability, the demographic groups most similar to Luxembourgers are Immigrants from Serbia (11.6%, a difference of 0.020%), Immigrants from Poland (11.6%, a difference of 0.050%), Palestinian (11.6%, a difference of 0.080%), Immigrants from Cameroon (11.6%, a difference of 0.080%), and Immigrants from Denmark (11.6%, a difference of 0.15%).
DemographicsRating | RankFemale Disability
Immigrants from Lebanon
99.7
/100
|
#75
Exceptional
11.5%
Immigrants from Eritrea
99.7
/100
|
#76
Exceptional
11.5%
Immigrants from Afghanistan
99.7
/100
|
#77
Exceptional
11.5%
Immigrants from South Africa
99.7
/100
|
#78
Exceptional
11.5%
Sierra Leoneans
99.7
/100
|
#79
Exceptional
11.5%
Immigrants from Jordan
99.7
/100
|
#80
Exceptional
11.5%
Eastern Europeans
99.7
/100
|
#81
Exceptional
11.5%
Luxembourgers
99.6
/100
|
#82
Exceptional
11.6%
Immigrants from Serbia
99.6
/100
|
#83
Exceptional
11.6%
Immigrants from Poland
99.6
/100
|
#84
Exceptional
11.6%
Palestinians
99.6
/100
|
#85
Exceptional
11.6%
Immigrants from Cameroon
99.6
/100
|
#86
Exceptional
11.6%
Immigrants from Denmark
99.5
/100
|
#87
Exceptional
11.6%
Yup'ik
99.5
/100
|
#88
Exceptional
11.6%
Vietnamese
99.5
/100
|
#89
Exceptional
11.6%

Luxembourger Female Disability Correlation Summary

MeasurementLuxembourger DataFemale Disability Data
Minimum0.026%3.8%
Maximum25.0%20.0%
Range25.0%16.2%
Mean4.9%10.9%
Median3.4%11.1%
Interquartile 25% (IQ1)1.6%9.2%
Interquartile 75% (IQ3)6.2%12.8%
Interquartile Range (IQR)4.6%3.6%
Standard Deviation (Sample)5.4%3.3%
Standard Deviation (Population)5.3%3.3%

Correlation Details

Luxembourger PercentileSample SizeFemale Disability
[
0.0%
-
0.5%
]
0.026%
133,175,45212.1%
[
0.0%
-
0.5%
]
0.18%
7,647,92711.2%
[
0.0%
-
0.5%
]
0.32%
1,625,97810.5%
[
0.0%
-
0.5%
]
0.46%
872,42710.4%
[
0.5%
-
1.0%
]
0.59%
427,07311.1%
[
0.5%
-
1.0%
]
0.72%
212,63811.2%
[
0.5%
-
1.0%
]
0.88%
175,13512.6%
[
1.0%
-
1.5%
]
1.01%
91,61812.9%
[
1.0%
-
1.5%
]
1.12%
52,97210.4%
[
1.0%
-
1.5%
]
1.27%
45,14112.9%
[
1.0%
-
1.5%
]
1.39%
108,68412.7%
[
1.5%
-
2.0%
]
1.51%
35,12911.9%
[
1.5%
-
2.0%
]
1.67%
13,13911.7%
[
1.5%
-
2.0%
]
1.81%
73,4349.9%
[
1.5%
-
2.0%
]
1.96%
9,95410.4%
[
2.0%
-
2.5%
]
2.06%
19,68612.3%
[
2.0%
-
2.5%
]
2.20%
7,91914.1%
[
2.0%
-
2.5%
]
2.35%
15,96912.7%
[
2.0%
-
2.5%
]
2.44%
6,9606.8%
[
2.5%
-
3.0%
]
2.66%
3,54011.0%
[
2.5%
-
3.0%
]
2.77%
25315.9%
[
3.0%
-
3.5%
]
3.03%
13215.7%
[
3.0%
-
3.5%
]
3.13%
1,98112.8%
[
3.0%
-
3.5%
]
3.27%
6,7249.9%
[
3.0%
-
3.5%
]
3.44%
96012.4%
[
3.5%
-
4.0%
]
3.73%
2,71112.7%
[
3.5%
-
4.0%
]
3.80%
795.1%
[
3.5%
-
4.0%
]
3.98%
5,15610.7%
[
4.0%
-
4.5%
]
4.20%
2,90210.5%
[
4.0%
-
4.5%
]
4.36%
4,9079.3%
[
4.5%
-
5.0%
]
4.56%
2,43310.4%
[
4.5%
-
5.0%
]
4.67%
1,0705.2%
[
4.5%
-
5.0%
]
4.95%
18213.1%
[
4.5%
-
5.0%
]
4.99%
3,80514.6%
[
5.5%
-
6.0%
]
5.62%
4985.6%
[
5.5%
-
6.0%
]
5.88%
5,4429.1%
[
6.0%
-
6.5%
]
6.44%
4197.2%
[
6.5%
-
7.0%
]
6.69%
1,1367.3%
[
6.5%
-
7.0%
]
6.78%
67813.4%
[
7.0%
-
7.5%
]
7.46%
3,0438.6%
[
7.5%
-
8.0%
]
7.88%
3,0966.4%
[
8.0%
-
8.5%
]
8.43%
1,28117.3%
[
8.5%
-
9.0%
]
8.69%
2,0959.5%
[
9.5%
-
10.0%
]
9.76%
3,5965.8%
[
10.5%
-
11.0%
]
10.80%
28715.0%
[
20.0%
-
20.5%
]
20.30%
1333.8%
[
23.0%
-
23.5%
]
23.16%
99320.0%
[
25.0%
-
25.5%
]
25.00%
2567.3%