Luxembourger 4 or more Vehicles in Household
COMPARE
Luxembourger
Select to Compare
4 or more Vehicles in Household
Luxembourger 4 or more Vehicles in Household
6.6%
4+ VEHICLES AVAILABLE
86.4/ 100
METRIC RATING
136th/ 347
METRIC RANK
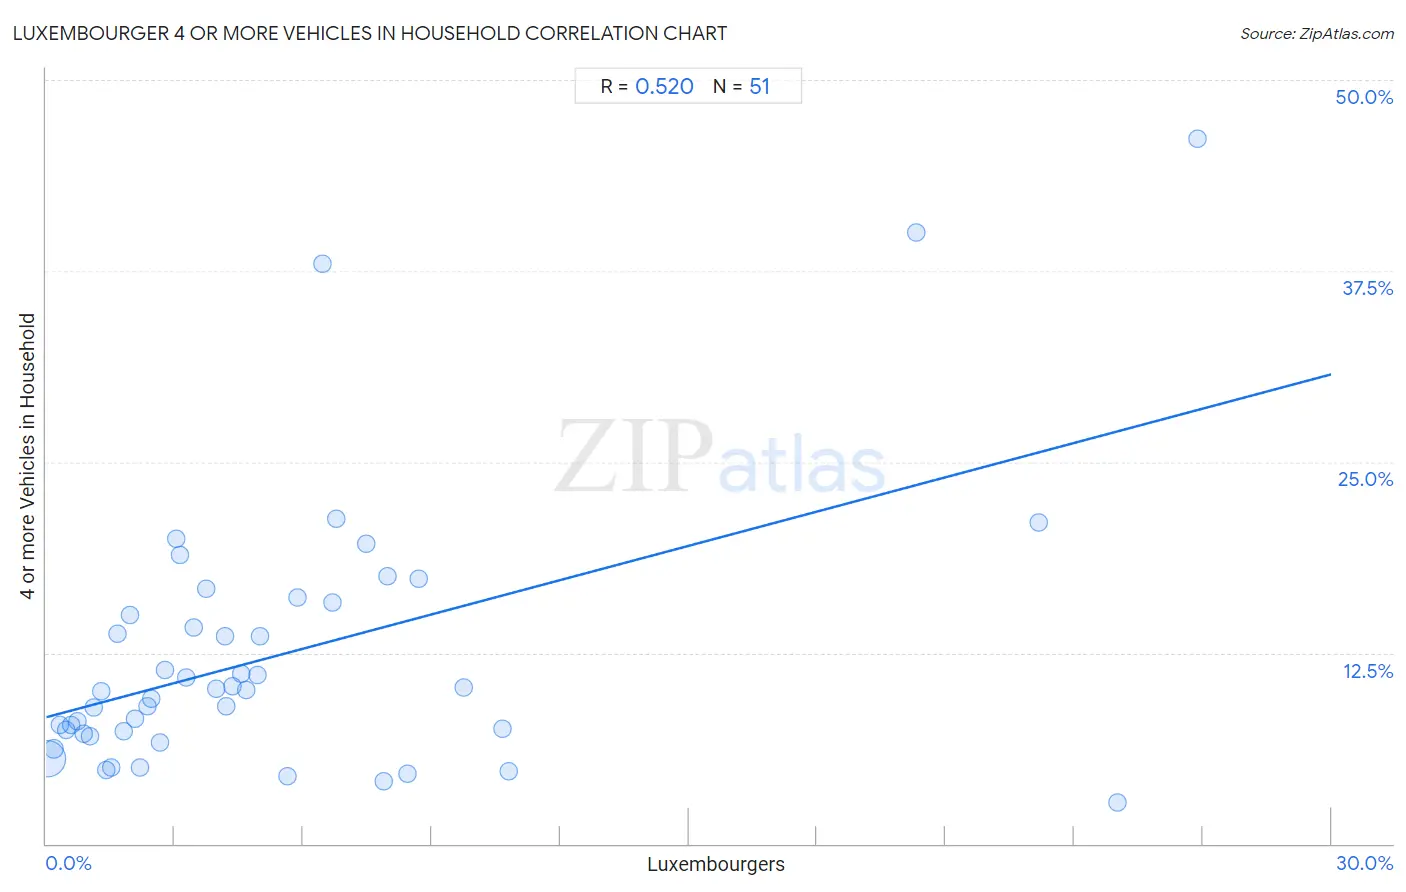
Luxembourger 4 or more Vehicles in Household Correlation Chart
The statistical analysis conducted on geographies consisting of 144,419,010 people shows a substantial positive correlation between the proportion of Luxembourgers and percentage of households with 4 or more vehicles available in the United States with a correlation coefficient (R) of 0.520 and weighted average of 6.6%. On average, for every 1% (one percent) increase in Luxembourgers within a typical geography, there is an increase of 0.75% in percentage of households with 4 or more vehicles available.
It is essential to understand that the correlation between the percentage of Luxembourgers and percentage of households with 4 or more vehicles available does not imply a direct cause-and-effect relationship. It remains uncertain whether the presence of Luxembourgers influences an upward or downward trend in the level of percentage of households with 4 or more vehicles available within an area, or if Luxembourgers simply ended up residing in those areas with higher or lower levels of percentage of households with 4 or more vehicles available due to other factors.
Demographics Similar to Luxembourgers by 4 or more Vehicles in Household
In terms of 4 or more vehicles in household, the demographic groups most similar to Luxembourgers are Tohono O'odham (6.6%, a difference of 0.070%), Ottawa (6.6%, a difference of 0.10%), Armenian (6.6%, a difference of 0.11%), French Canadian (6.6%, a difference of 0.21%), and Immigrants from Netherlands (6.6%, a difference of 0.31%).
| Demographics | Rating | Rank | 4 or more Vehicles in Household |
| Immigrants from England | 92.0 /100 | #129 | Exceptional 6.7% |
| Immigrants from Scotland | 89.0 /100 | #130 | Excellent 6.7% |
| Maltese | 88.4 /100 | #131 | Excellent 6.7% |
| Immigrants from Netherlands | 87.8 /100 | #132 | Excellent 6.6% |
| Armenians | 86.9 /100 | #133 | Excellent 6.6% |
| Ottawa | 86.9 /100 | #134 | Excellent 6.6% |
| Tohono O'odham | 86.7 /100 | #135 | Excellent 6.6% |
| Luxembourgers | 86.4 /100 | #136 | Excellent 6.6% |
| French Canadians | 85.4 /100 | #137 | Excellent 6.6% |
| Italians | 84.5 /100 | #138 | Excellent 6.6% |
| Jordanians | 82.1 /100 | #139 | Excellent 6.6% |
| Slavs | 81.6 /100 | #140 | Excellent 6.6% |
| Australians | 80.8 /100 | #141 | Excellent 6.6% |
| Immigrants from Iraq | 79.4 /100 | #142 | Good 6.5% |
| Immigrants from Canada | 78.6 /100 | #143 | Good 6.5% |
Luxembourger 4 or more Vehicles in Household Correlation Summary
| Measurement | Luxembourger Data | 4 or more Vehicles in Household Data |
| Minimum | 0.026% | 2.7% |
| Maximum | 26.9% | 46.2% |
| Range | 26.8% | 43.5% |
| Mean | 5.5% | 12.4% |
| Median | 3.7% | 10.0% |
| Interquartile 25% (IQ1) | 1.7% | 7.2% |
| Interquartile 75% (IQ3) | 6.8% | 15.8% |
| Interquartile Range (IQR) | 5.1% | 8.6% |
| Standard Deviation (Sample) | 6.1% | 8.8% |
| Standard Deviation (Population) | 6.1% | 8.7% |
Correlation Details
| Luxembourger Percentile | Sample Size | 4 or more Vehicles in Household |
[ 0.0% - 0.5% ] 0.026% | 132,964,483 | 5.5% |
[ 0.0% - 0.5% ] 0.18% | 7,626,249 | 6.2% |
[ 0.0% - 0.5% ] 0.32% | 1,612,097 | 7.8% |
[ 0.0% - 0.5% ] 0.46% | 863,519 | 7.4% |
[ 0.5% - 1.0% ] 0.59% | 426,727 | 7.8% |
[ 0.5% - 1.0% ] 0.72% | 212,638 | 8.0% |
[ 0.5% - 1.0% ] 0.88% | 174,183 | 7.2% |
[ 1.0% - 1.5% ] 1.01% | 90,760 | 7.0% |
[ 1.0% - 1.5% ] 1.12% | 52,972 | 8.9% |
[ 1.0% - 1.5% ] 1.27% | 45,141 | 10.0% |
[ 1.0% - 1.5% ] 1.39% | 108,684 | 4.8% |
[ 1.5% - 2.0% ] 1.52% | 33,531 | 5.0% |
[ 1.5% - 2.0% ] 1.67% | 13,139 | 13.7% |
[ 1.5% - 2.0% ] 1.81% | 73,434 | 7.4% |
[ 1.5% - 2.0% ] 1.96% | 9,954 | 15.0% |
[ 2.0% - 2.5% ] 2.06% | 20,181 | 8.2% |
[ 2.0% - 2.5% ] 2.20% | 7,919 | 5.0% |
[ 2.0% - 2.5% ] 2.35% | 15,635 | 9.0% |
[ 2.0% - 2.5% ] 2.44% | 6,960 | 9.5% |
[ 2.5% - 3.0% ] 2.66% | 3,540 | 6.6% |
[ 2.5% - 3.0% ] 2.77% | 253 | 11.4% |
[ 3.0% - 3.5% ] 3.03% | 132 | 20.0% |
[ 3.0% - 3.5% ] 3.13% | 1,981 | 18.9% |
[ 3.0% - 3.5% ] 3.27% | 6,724 | 10.9% |
[ 3.0% - 3.5% ] 3.44% | 960 | 14.2% |
[ 3.5% - 4.0% ] 3.73% | 2,711 | 16.7% |
[ 3.5% - 4.0% ] 3.98% | 5,156 | 10.1% |
[ 4.0% - 4.5% ] 4.16% | 529 | 13.6% |
[ 4.0% - 4.5% ] 4.20% | 2,902 | 9.0% |
[ 4.0% - 4.5% ] 4.36% | 4,907 | 10.3% |
[ 4.5% - 5.0% ] 4.56% | 2,499 | 11.1% |
[ 4.5% - 5.0% ] 4.67% | 1,070 | 10.0% |
[ 4.5% - 5.0% ] 4.95% | 182 | 11.0% |
[ 4.5% - 5.0% ] 4.99% | 3,805 | 13.6% |
[ 5.5% - 6.0% ] 5.63% | 462 | 4.4% |
[ 5.5% - 6.0% ] 5.88% | 5,442 | 16.1% |
[ 6.0% - 6.5% ] 6.44% | 419 | 38.0% |
[ 6.5% - 7.0% ] 6.69% | 1,136 | 15.8% |
[ 6.5% - 7.0% ] 6.78% | 678 | 21.3% |
[ 7.0% - 7.5% ] 7.46% | 3,164 | 19.6% |
[ 7.5% - 8.0% ] 7.88% | 3,096 | 4.1% |
[ 7.5% - 8.0% ] 7.96% | 113 | 17.5% |
[ 8.0% - 8.5% ] 8.43% | 1,281 | 4.6% |
[ 8.5% - 9.0% ] 8.69% | 2,095 | 17.4% |
[ 9.5% - 10.0% ] 9.76% | 3,596 | 10.2% |
[ 10.5% - 11.0% ] 10.64% | 235 | 7.5% |
[ 10.5% - 11.0% ] 10.80% | 287 | 4.8% |
[ 20.0% - 20.5% ] 20.30% | 133 | 40.0% |
[ 23.0% - 23.5% ] 23.16% | 993 | 21.0% |
[ 25.0% - 25.5% ] 25.00% | 256 | 2.7% |
[ 26.5% - 27.0% ] 26.87% | 67 | 46.2% |