Luxembourger 2 or more Vehicles in Household

COMPARE

Luxembourger
Race
Ancestry
AfghanAfricanAlaska NativeAlaskan AthabascanAlbanianAleutAlsatianAmericanApacheArabArapahoArgentineanArmenianAssyrian/Chaldean/SyriacAustralianAustrianBahamianBangladeshiBarbadianBasqueBelgianBelizeanBermudanBhutaneseBlackfeetBolivianBrazilianBritishBritish West IndianBulgarianBurmeseCajunCambodianCanadianCape VerdeanCarpatho RusynCelticCentral AmericanCentral American IndianCherokeeCheyenneChickasawChileanChineseChippewaChoctawColombianColvilleComancheCosta RicanCreeCreekCroatianCrowCubanCypriotCzechCzechoslovakianDanishDelawareDominicanDutchDutch West IndianEastern EuropeanEcuadorianEgyptianEnglishEstonianEthiopianEuropeanFijianFilipinoFinnishFrenchFrench American IndianFrench CanadianGermanGerman RussianGhanaianGreekGuamanian/ChamorroGuatemalanGuyaneseHaitianHmongHonduranHopiHoumaHungarianIcelanderIndian (Asian)IndonesianInupiatIranianIraqiIrishIroquoisIsraeliItalianJamaicanJapaneseJordanianKenyanKiowaKoreanLaotianLatvianLebaneseLiberianLithuanianLumbeeLuxembourgerMacedonianMalaysianMalteseMarshalleseMenomineeMexicanMexican American IndianMongolianMoroccanNative HawaiianNavajoNepaleseNew ZealanderNicaraguanNigerianNorthern EuropeanNorwegianOkinawanOsageOttawaPaiutePakistaniPalestinianPanamanianParaguayanPennsylvania GermanPeruvianPimaPolishPortuguesePotawatomiPuebloPuerto RicanPuget Sound SalishRomanianRussianSalvadoranSamoanScandinavianScotch-IrishScottishSeminoleSenegaleseSerbianShoshoneSierra LeoneanSiouxSlavicSlovakSloveneSomaliSouth AfricanSouth AmericanSouth American IndianSoviet UnionSpaniardSpanishSpanish AmericanSpanish American IndianSri LankanSubsaharan AfricanSudaneseSwedishSwissSyrianTaiwaneseThaiTlingit-HaidaTohono O'OdhamTonganTrinidadian and TobagonianTsimshianTurkishU.S. Virgin IslanderUgandanUkrainianUruguayanUteVenezuelanVietnameseWelshWest IndianYakamaYaquiYugoslavianYumanYup'ikZimbabwean
Immigration
NonimmigrantsImmigrantsAfghanistanAfricaAlbaniaArgentinaArmeniaAsiaAustraliaAustriaBahamasBangladeshBarbadosBelarusBelgiumBelizeBoliviaBosnia and HerzegovinaBrazilBulgariaBurma/MyanmarCabo VerdeCambodiaCameroonCanadaCaribbeanCentral AmericaChileChinaColombiaCongoCosta RicaCroatiaCubaCzechoslovakiaDenmarkDominicaDominican RepublicEastern AfricaEastern AsiaEastern EuropeEcuadorEgyptEl SalvadorEnglandEritreaEthiopiaEuropeFijiFranceGermanyGhanaGreeceGrenadaGuatemalaGuyanaHaitiHondurasHong KongHungaryIndiaIndonesiaIranIraqIrelandIsraelItalyJamaicaJapanJordanKazakhstanKenyaKoreaKuwaitLaosLatin AmericaLatviaLebanonLiberiaLithuaniaMalaysiaMexicoMicronesiaMiddle AfricaMoldovaMoroccoNepalNetherlandsNicaraguaNigeriaNorth AmericaNorth MacedoniaNorthern AfricaNorthern EuropeNorwayOceaniaPakistanPanamaPeruPhilippinesPolandPortugalRomaniaRussiaSaudi ArabiaScotlandSenegalSerbiaSierra LeoneSingaporeSomaliaSouth AfricaSouth AmericaSouth Central AsiaSouth Eastern AsiaSouthern EuropeSpainSri LankaSt. Vincent and the GrenadinesSudanSwedenSwitzerlandSyriaTaiwanThailandTrinidad and TobagoTurkeyUgandaUkraineUruguayUzbekistanVenezuelaVietnamWest IndiesWestern AfricaWestern AsiaWestern EuropeYemenZaireZimbabweAzores
Select to Compare
Race
Ancestry
AfghanAfricanAlaska NativeAlaskan AthabascanAlbanianAleutAlsatianAmericanApacheArabArapahoArgentineanArmenianAssyrian/Chaldean/SyriacAustralianAustrianBahamianBangladeshiBarbadianBasqueBelgianBelizeanBermudanBhutaneseBlackfeetBolivianBrazilianBritishBritish West IndianBulgarianBurmeseCajunCambodianCanadianCape VerdeanCarpatho RusynCelticCentral AmericanCentral American IndianCherokeeCheyenneChickasawChileanChineseChippewaChoctawColombianColvilleComancheCosta RicanCreeCreekCroatianCrowCubanCypriotCzechCzechoslovakianDanishDelawareDominicanDutchDutch West IndianEastern EuropeanEcuadorianEgyptianEnglishEstonianEthiopianEuropeanFijianFilipinoFinnishFrenchFrench American IndianFrench CanadianGermanGerman RussianGhanaianGreekGuamanian/ChamorroGuatemalanGuyaneseHaitianHmongHonduranHopiHoumaHungarianIcelanderIndian (Asian)IndonesianInupiatIranianIraqiIrishIroquoisIsraeliItalianJamaicanJapaneseJordanianKenyanKiowaKoreanLaotianLatvianLebaneseLiberianLithuanianLumbeeMacedonianMalaysianMalteseMarshalleseMenomineeMexicanMexican American IndianMongolianMoroccanNative HawaiianNavajoNepaleseNew ZealanderNicaraguanNigerianNorthern EuropeanNorwegianOkinawanOsageOttawaPaiutePakistaniPalestinianPanamanianParaguayanPennsylvania GermanPeruvianPimaPolishPortuguesePotawatomiPuebloPuerto RicanPuget Sound SalishRomanianRussianSalvadoranSamoanScandinavianScotch-IrishScottishSeminoleSenegaleseSerbianShoshoneSierra LeoneanSiouxSlavicSlovakSloveneSomaliSouth AfricanSouth AmericanSouth American IndianSoviet UnionSpaniardSpanishSpanish AmericanSpanish American IndianSri LankanSubsaharan AfricanSudaneseSwedishSwissSyrianTaiwaneseThaiTlingit-HaidaTohono O'OdhamTonganTrinidadian and TobagonianTsimshianTurkishU.S. Virgin IslanderUgandanUkrainianUruguayanUteVenezuelanVietnameseWelshWest IndianYakamaYaquiYugoslavianYumanYup'ikZimbabwean
Immigration
NonimmigrantsImmigrantsAfghanistanAfricaAlbaniaArgentinaArmeniaAsiaAustraliaAustriaBahamasBangladeshBarbadosBelarusBelgiumBelizeBoliviaBosnia and HerzegovinaBrazilBulgariaBurma/MyanmarCabo VerdeCambodiaCameroonCanadaCaribbeanCentral AmericaChileChinaColombiaCongoCosta RicaCroatiaCubaCzechoslovakiaDenmarkDominicaDominican RepublicEastern AfricaEastern AsiaEastern EuropeEcuadorEgyptEl SalvadorEnglandEritreaEthiopiaEuropeFijiFranceGermanyGhanaGreeceGrenadaGuatemalaGuyanaHaitiHondurasHong KongHungaryIndiaIndonesiaIranIraqIrelandIsraelItalyJamaicaJapanJordanKazakhstanKenyaKoreaKuwaitLaosLatin AmericaLatviaLebanonLiberiaLithuaniaMalaysiaMexicoMicronesiaMiddle AfricaMoldovaMoroccoNepalNetherlandsNicaraguaNigeriaNorth AmericaNorth MacedoniaNorthern AfricaNorthern EuropeNorwayOceaniaPakistanPanamaPeruPhilippinesPolandPortugalRomaniaRussiaSaudi ArabiaScotlandSenegalSerbiaSierra LeoneSingaporeSomaliaSouth AfricaSouth AmericaSouth Central AsiaSouth Eastern AsiaSouthern EuropeSpainSri LankaSt. Vincent and the GrenadinesSudanSwedenSwitzerlandSyriaTaiwanThailandTrinidad and TobagoTurkeyUgandaUkraineUruguayUzbekistanVenezuelaVietnamWest IndiesWestern AfricaWestern AsiaWestern EuropeYemenZaireZimbabweAzores
2 or more Vehicles in Household
Income
Poverty
Unemployment
Labor Participation
Family Structure
Vehicle Availability
Education Level
Disability

Luxembourger 2 or more Vehicles in Household
Exceptional

59.1%
2+ VEHICLES AVAILABLE
99.9/ 100
METRIC RATING
55th/ 347
METRIC RANK

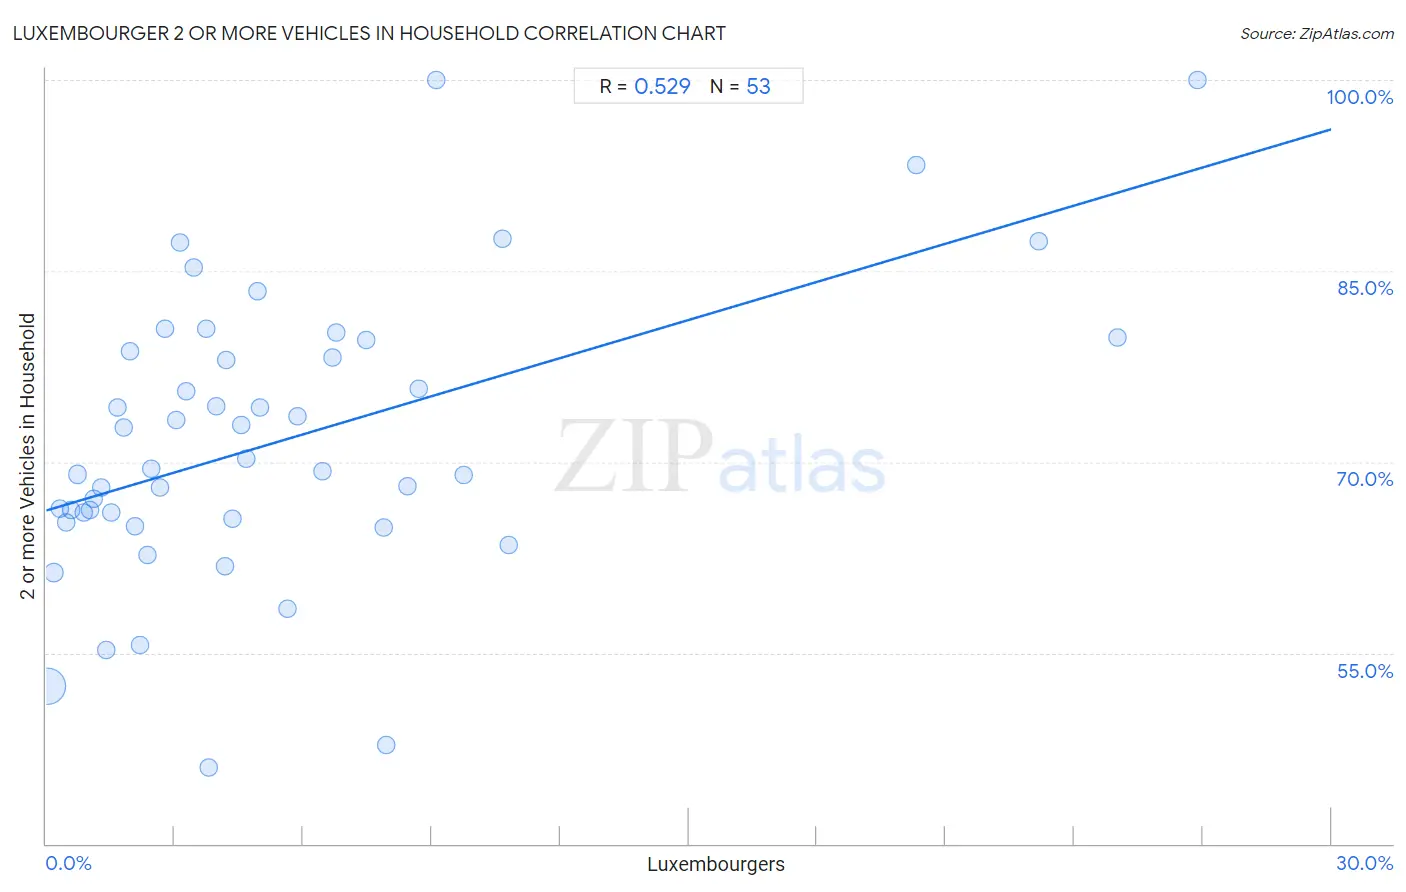
Luxembourger 2 or more Vehicles in Household Correlation Chart

The statistical analysis conducted on geographies consisting of 144,657,746 people shows a substantial positive correlation between the proportion of Luxembourgers and percentage of households with 2 or more vehicles available in the United States with a correlation coefficient (R) of 0.529 and weighted average of 59.1%. On average, for every 1% (one percent) increase in Luxembourgers within a typical geography, there is an increase of 1.00% in percentage of households with 2 or more vehicles available.
Luxembourger 2 or more Vehicles in Household
It is essential to understand that the correlation between the percentage of Luxembourgers and percentage of households with 2 or more vehicles available does not imply a direct cause-and-effect relationship. It remains uncertain whether the presence of Luxembourgers influences an upward or downward trend in the level of percentage of households with 2 or more vehicles available within an area, or if Luxembourgers simply ended up residing in those areas with higher or lower levels of percentage of households with 2 or more vehicles available due to other factors.

Demographics Similar to Luxembourgers by 2 or more Vehicles in Household

In terms of 2 or more vehicles in household, the demographic groups most similar to Luxembourgers are Bhutanese (59.1%, a difference of 0.030%), Chickasaw (59.0%, a difference of 0.11%), Afghan (59.0%, a difference of 0.11%), Celtic (59.2%, a difference of 0.18%), and Spaniard (59.2%, a difference of 0.19%).
DemographicsRating | Rank2 or more Vehicles in Household
Immigrants from India
99.9
/100
|
#48
Exceptional
59.3%
Belgians
99.9
/100
|
#49
Exceptional
59.3%
Choctaw
99.9
/100
|
#50
Exceptional
59.3%
Spaniards
99.9
/100
|
#51
Exceptional
59.2%
Immigrants from Laos
99.9
/100
|
#52
Exceptional
59.2%
Celtics
99.9
/100
|
#53
Exceptional
59.2%
Bhutanese
99.9
/100
|
#54
Exceptional
59.1%
Luxembourgers
99.9
/100
|
#55
Exceptional
59.1%
Chickasaw
99.9
/100
|
#56
Exceptional
59.0%
Afghans
99.9
/100
|
#57
Exceptional
59.0%
Immigrants from Scotland
99.8
/100
|
#58
Exceptional
58.9%
Spanish Americans
99.8
/100
|
#59
Exceptional
58.9%
French Canadians
99.8
/100
|
#60
Exceptional
58.9%
Osage
99.8
/100
|
#61
Exceptional
58.8%
Nonimmigrants
99.8
/100
|
#62
Exceptional
58.8%

Luxembourger 2 or more Vehicles in Household Correlation Summary

MeasurementLuxembourger Data2 or more Vehicles in Household Data
Minimum0.026%46.0%
Maximum26.9%100.0%
Range26.8%54.0%
Mean5.5%71.7%
Median3.8%69.5%
Interquartile 25% (IQ1)1.7%65.4%
Interquartile 75% (IQ3)7.1%79.1%
Interquartile Range (IQR)5.4%13.7%
Standard Deviation (Sample)6.0%11.4%
Standard Deviation (Population)6.0%11.3%

Correlation Details

Luxembourger PercentileSample Size2 or more Vehicles in Household
[
0.0%
-
0.5%
]
0.026%
133,161,40452.4%
[
0.0%
-
0.5%
]
0.18%
7,639,36961.3%
[
0.0%
-
0.5%
]
0.32%
1,625,97866.3%
[
0.0%
-
0.5%
]
0.46%
873,93865.3%
[
0.5%
-
1.0%
]
0.59%
427,07366.2%
[
0.5%
-
1.0%
]
0.72%
212,63869.0%
[
0.5%
-
1.0%
]
0.88%
175,13566.0%
[
1.0%
-
1.5%
]
1.01%
90,86066.2%
[
1.0%
-
1.5%
]
1.12%
52,97267.1%
[
1.0%
-
1.5%
]
1.27%
45,14168.0%
[
1.0%
-
1.5%
]
1.39%
108,68455.2%
[
1.5%
-
2.0%
]
1.51%
35,12966.0%
[
1.5%
-
2.0%
]
1.67%
13,13974.3%
[
1.5%
-
2.0%
]
1.81%
73,43472.7%
[
1.5%
-
2.0%
]
1.96%
9,95478.7%
[
2.0%
-
2.5%
]
2.06%
20,18164.9%
[
2.0%
-
2.5%
]
2.20%
7,91955.6%
[
2.0%
-
2.5%
]
2.35%
16,57362.7%
[
2.0%
-
2.5%
]
2.44%
6,96069.5%
[
2.5%
-
3.0%
]
2.66%
3,54068.0%
[
2.5%
-
3.0%
]
2.77%
25380.4%
[
3.0%
-
3.5%
]
3.03%
13273.3%
[
3.0%
-
3.5%
]
3.13%
1,98187.2%
[
3.0%
-
3.5%
]
3.27%
6,72475.5%
[
3.0%
-
3.5%
]
3.44%
96085.3%
[
3.5%
-
4.0%
]
3.73%
2,71180.5%
[
3.5%
-
4.0%
]
3.80%
7946.0%
[
3.5%
-
4.0%
]
3.98%
5,15674.4%
[
4.0%
-
4.5%
]
4.16%
52961.8%
[
4.0%
-
4.5%
]
4.20%
2,90278.0%
[
4.0%
-
4.5%
]
4.36%
4,90765.5%
[
4.5%
-
5.0%
]
4.56%
2,49972.9%
[
4.5%
-
5.0%
]
4.67%
1,07070.2%
[
4.5%
-
5.0%
]
4.95%
18283.4%
[
4.5%
-
5.0%
]
4.99%
3,80574.3%
[
5.5%
-
6.0%
]
5.62%
49858.5%
[
5.5%
-
6.0%
]
5.88%
5,44273.6%
[
6.0%
-
6.5%
]
6.44%
41969.3%
[
6.5%
-
7.0%
]
6.69%
1,13678.2%
[
6.5%
-
7.0%
]
6.78%
67880.1%
[
7.0%
-
7.5%
]
7.46%
3,16479.5%
[
7.5%
-
8.0%
]
7.88%
3,09664.9%
[
7.5%
-
8.0%
]
7.95%
41547.7%
[
8.0%
-
8.5%
]
8.43%
1,28168.1%
[
8.5%
-
9.0%
]
8.69%
2,09575.8%
[
9.0%
-
9.5%
]
9.09%
44100.0%
[
9.5%
-
10.0%
]
9.76%
3,59669.0%
[
10.5%
-
11.0%
]
10.64%
23587.5%
[
10.5%
-
11.0%
]
10.80%
28763.5%
[
20.0%
-
20.5%
]
20.30%
13393.3%
[
23.0%
-
23.5%
]
23.16%
99387.3%
[
25.0%
-
25.5%
]
25.00%
25679.7%
[
26.5%
-
27.0%
]
26.87%
67100.0%