Luxembourger Receiving Food Stamps

COMPARE

Luxembourger
Race
Ancestry
AfghanAfricanAlaska NativeAlaskan AthabascanAlbanianAleutAlsatianAmericanApacheArabArapahoArgentineanArmenianAssyrian/Chaldean/SyriacAustralianAustrianBahamianBangladeshiBarbadianBasqueBelgianBelizeanBermudanBhutaneseBlackfeetBolivianBrazilianBritishBritish West IndianBulgarianBurmeseCajunCambodianCanadianCape VerdeanCarpatho RusynCelticCentral AmericanCentral American IndianCherokeeCheyenneChickasawChileanChineseChippewaChoctawColombianColvilleComancheCosta RicanCreeCreekCroatianCrowCubanCypriotCzechCzechoslovakianDanishDelawareDominicanDutchDutch West IndianEastern EuropeanEcuadorianEgyptianEnglishEstonianEthiopianEuropeanFijianFilipinoFinnishFrenchFrench American IndianFrench CanadianGermanGerman RussianGhanaianGreekGuamanian/ChamorroGuatemalanGuyaneseHaitianHmongHonduranHopiHoumaHungarianIcelanderIndian (Asian)IndonesianInupiatIranianIraqiIrishIroquoisIsraeliItalianJamaicanJapaneseJordanianKenyanKiowaKoreanLaotianLatvianLebaneseLiberianLithuanianLumbeeLuxembourgerMacedonianMalaysianMalteseMarshalleseMenomineeMexicanMexican American IndianMongolianMoroccanNative HawaiianNavajoNepaleseNew ZealanderNicaraguanNigerianNorthern EuropeanNorwegianOkinawanOsageOttawaPaiutePakistaniPalestinianPanamanianParaguayanPennsylvania GermanPeruvianPimaPolishPortuguesePotawatomiPuebloPuerto RicanPuget Sound SalishRomanianRussianSalvadoranSamoanScandinavianScotch-IrishScottishSeminoleSenegaleseSerbianShoshoneSierra LeoneanSiouxSlavicSlovakSloveneSomaliSouth AfricanSouth AmericanSouth American IndianSoviet UnionSpaniardSpanishSpanish AmericanSpanish American IndianSri LankanSubsaharan AfricanSudaneseSwedishSwissSyrianTaiwaneseThaiTlingit-HaidaTohono O'OdhamTonganTrinidadian and TobagonianTsimshianTurkishU.S. Virgin IslanderUgandanUkrainianUruguayanUteVenezuelanVietnameseWelshWest IndianYakamaYaquiYugoslavianYumanYup'ikZimbabwean
Immigration
NonimmigrantsImmigrantsAfghanistanAfricaAlbaniaArgentinaArmeniaAsiaAustraliaAustriaBahamasBangladeshBarbadosBelarusBelgiumBelizeBoliviaBosnia and HerzegovinaBrazilBulgariaBurma/MyanmarCabo VerdeCambodiaCameroonCanadaCaribbeanCentral AmericaChileChinaColombiaCongoCosta RicaCroatiaCubaCzechoslovakiaDenmarkDominicaDominican RepublicEastern AfricaEastern AsiaEastern EuropeEcuadorEgyptEl SalvadorEnglandEritreaEthiopiaEuropeFijiFranceGermanyGhanaGreeceGrenadaGuatemalaGuyanaHaitiHondurasHong KongHungaryIndiaIndonesiaIranIraqIrelandIsraelItalyJamaicaJapanJordanKazakhstanKenyaKoreaKuwaitLaosLatin AmericaLatviaLebanonLiberiaLithuaniaMalaysiaMexicoMicronesiaMiddle AfricaMoldovaMoroccoNepalNetherlandsNicaraguaNigeriaNorth AmericaNorth MacedoniaNorthern AfricaNorthern EuropeNorwayOceaniaPakistanPanamaPeruPhilippinesPolandPortugalRomaniaRussiaSaudi ArabiaScotlandSenegalSerbiaSierra LeoneSingaporeSomaliaSouth AfricaSouth AmericaSouth Central AsiaSouth Eastern AsiaSouthern EuropeSpainSri LankaSt. Vincent and the GrenadinesSudanSwedenSwitzerlandSyriaTaiwanThailandTrinidad and TobagoTurkeyUgandaUkraineUruguayUzbekistanVenezuelaVietnamWest IndiesWestern AfricaWestern AsiaWestern EuropeYemenZaireZimbabweAzores
Select to Compare
Race
Ancestry
AfghanAfricanAlaska NativeAlaskan AthabascanAlbanianAleutAlsatianAmericanApacheArabArapahoArgentineanArmenianAssyrian/Chaldean/SyriacAustralianAustrianBahamianBangladeshiBarbadianBasqueBelgianBelizeanBermudanBhutaneseBlackfeetBolivianBrazilianBritishBritish West IndianBulgarianBurmeseCajunCambodianCanadianCape VerdeanCarpatho RusynCelticCentral AmericanCentral American IndianCherokeeCheyenneChickasawChileanChineseChippewaChoctawColombianColvilleComancheCosta RicanCreeCreekCroatianCrowCubanCypriotCzechCzechoslovakianDanishDelawareDominicanDutchDutch West IndianEastern EuropeanEcuadorianEgyptianEnglishEstonianEthiopianEuropeanFijianFilipinoFinnishFrenchFrench American IndianFrench CanadianGermanGerman RussianGhanaianGreekGuamanian/ChamorroGuatemalanGuyaneseHaitianHmongHonduranHopiHoumaHungarianIcelanderIndian (Asian)IndonesianInupiatIranianIraqiIrishIroquoisIsraeliItalianJamaicanJapaneseJordanianKenyanKiowaKoreanLaotianLatvianLebaneseLiberianLithuanianLumbeeMacedonianMalaysianMalteseMarshalleseMenomineeMexicanMexican American IndianMongolianMoroccanNative HawaiianNavajoNepaleseNew ZealanderNicaraguanNigerianNorthern EuropeanNorwegianOkinawanOsageOttawaPaiutePakistaniPalestinianPanamanianParaguayanPennsylvania GermanPeruvianPimaPolishPortuguesePotawatomiPuebloPuerto RicanPuget Sound SalishRomanianRussianSalvadoranSamoanScandinavianScotch-IrishScottishSeminoleSenegaleseSerbianShoshoneSierra LeoneanSiouxSlavicSlovakSloveneSomaliSouth AfricanSouth AmericanSouth American IndianSoviet UnionSpaniardSpanishSpanish AmericanSpanish American IndianSri LankanSubsaharan AfricanSudaneseSwedishSwissSyrianTaiwaneseThaiTlingit-HaidaTohono O'OdhamTonganTrinidadian and TobagonianTsimshianTurkishU.S. Virgin IslanderUgandanUkrainianUruguayanUteVenezuelanVietnameseWelshWest IndianYakamaYaquiYugoslavianYumanYup'ikZimbabwean
Immigration
NonimmigrantsImmigrantsAfghanistanAfricaAlbaniaArgentinaArmeniaAsiaAustraliaAustriaBahamasBangladeshBarbadosBelarusBelgiumBelizeBoliviaBosnia and HerzegovinaBrazilBulgariaBurma/MyanmarCabo VerdeCambodiaCameroonCanadaCaribbeanCentral AmericaChileChinaColombiaCongoCosta RicaCroatiaCubaCzechoslovakiaDenmarkDominicaDominican RepublicEastern AfricaEastern AsiaEastern EuropeEcuadorEgyptEl SalvadorEnglandEritreaEthiopiaEuropeFijiFranceGermanyGhanaGreeceGrenadaGuatemalaGuyanaHaitiHondurasHong KongHungaryIndiaIndonesiaIranIraqIrelandIsraelItalyJamaicaJapanJordanKazakhstanKenyaKoreaKuwaitLaosLatin AmericaLatviaLebanonLiberiaLithuaniaMalaysiaMexicoMicronesiaMiddle AfricaMoldovaMoroccoNepalNetherlandsNicaraguaNigeriaNorth AmericaNorth MacedoniaNorthern AfricaNorthern EuropeNorwayOceaniaPakistanPanamaPeruPhilippinesPolandPortugalRomaniaRussiaSaudi ArabiaScotlandSenegalSerbiaSierra LeoneSingaporeSomaliaSouth AfricaSouth AmericaSouth Central AsiaSouth Eastern AsiaSouthern EuropeSpainSri LankaSt. Vincent and the GrenadinesSudanSwedenSwitzerlandSyriaTaiwanThailandTrinidad and TobagoTurkeyUgandaUkraineUruguayUzbekistanVenezuelaVietnamWest IndiesWestern AfricaWestern AsiaWestern EuropeYemenZaireZimbabweAzores
Receiving Food Stamps
Income
Poverty
Unemployment
Labor Participation
Family Structure
Vehicle Availability
Education Level
Disability

Luxembourger Receiving Food Stamps
Exceptional

9.1%
PUBLIC INCOME | FOOD STAMPS
99.8/ 100
METRIC RATING
21st/ 347
METRIC RANK

Luxembourger Receiving Food Stamps Correlation Chart

The statistical analysis conducted on geographies consisting of 144,526,649 people shows a mild negative correlation between the proportion of Luxembourgers and percentage of population receiving government assistance and/or food stamps in the United States with a correlation coefficient (R) of -0.362 and weighted average of 9.1%. On average, for every 1% (one percent) increase in Luxembourgers within a typical geography, there is a decrease of 0.23% in percentage of population receiving government assistance and/or food stamps.
Luxembourger Receiving Food Stamps
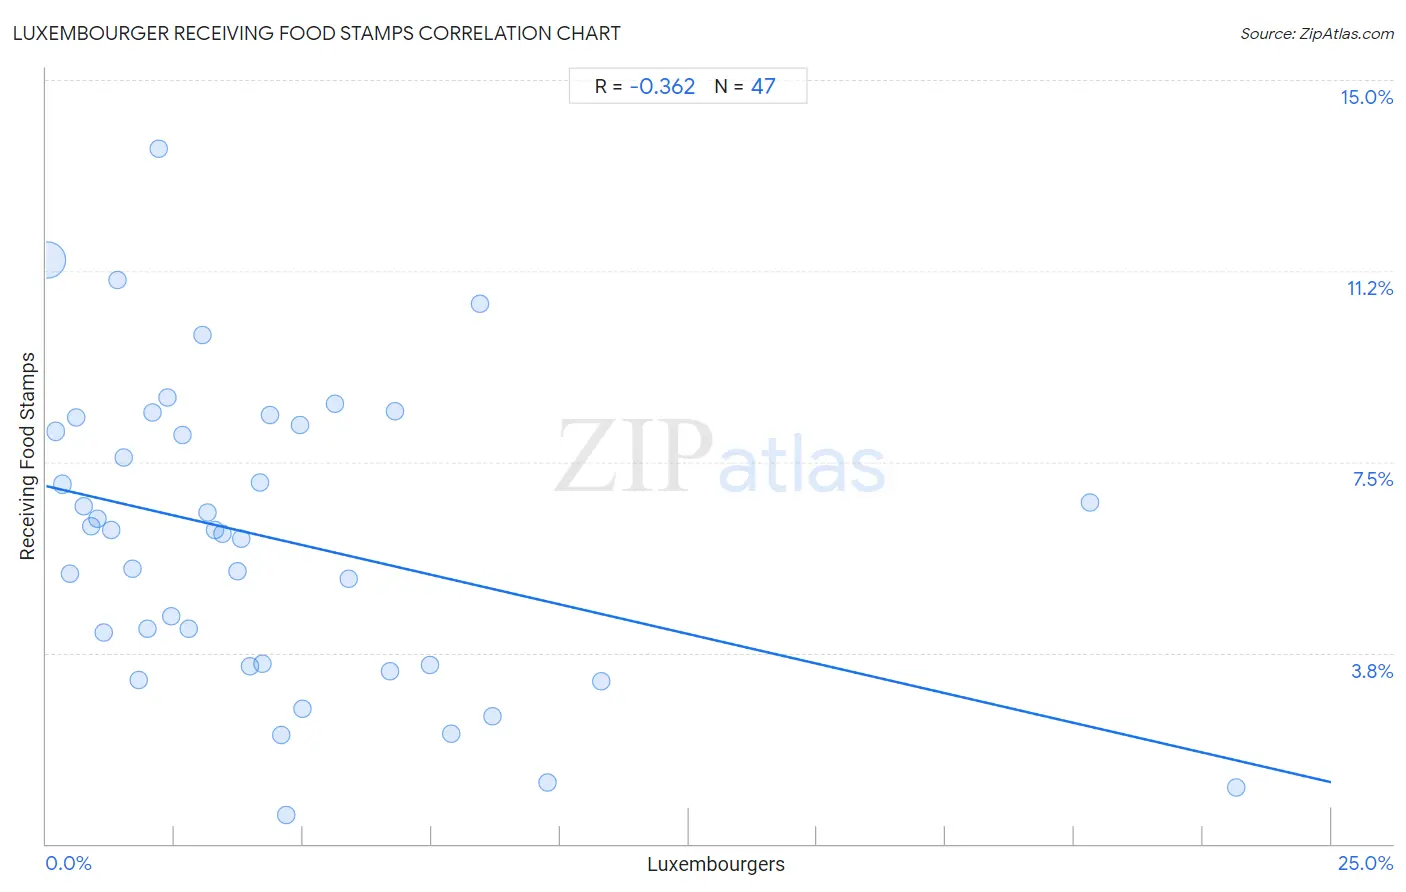
It is essential to understand that the correlation between the percentage of Luxembourgers and percentage of population receiving government assistance and/or food stamps does not imply a direct cause-and-effect relationship. It remains uncertain whether the presence of Luxembourgers influences an upward or downward trend in the level of percentage of population receiving government assistance and/or food stamps within an area, or if Luxembourgers simply ended up residing in those areas with higher or lower levels of percentage of population receiving government assistance and/or food stamps due to other factors.

Demographics Similar to Luxembourgers by Receiving Food Stamps

In terms of receiving food stamps, the demographic groups most similar to Luxembourgers are Latvian (9.1%, a difference of 0.15%), Immigrants from Australia (9.2%, a difference of 0.25%), Eastern European (9.2%, a difference of 0.36%), Immigrants from Northern Europe (9.2%, a difference of 0.38%), and Immigrants from Hong Kong (9.1%, a difference of 0.48%).
DemographicsRating | RankReceiving Food Stamps
Maltese
99.9
/100
|
#14
Exceptional
8.9%
Norwegians
99.9
/100
|
#15
Exceptional
9.0%
Immigrants from Japan
99.9
/100
|
#16
Exceptional
9.0%
Immigrants from Scotland
99.9
/100
|
#17
Exceptional
9.0%
Danes
99.9
/100
|
#18
Exceptional
9.0%
Immigrants from Hong Kong
99.8
/100
|
#19
Exceptional
9.1%
Latvians
99.8
/100
|
#20
Exceptional
9.1%
Luxembourgers
99.8
/100
|
#21
Exceptional
9.1%
Immigrants from Australia
99.8
/100
|
#22
Exceptional
9.2%
Eastern Europeans
99.8
/100
|
#23
Exceptional
9.2%
Immigrants from Northern Europe
99.8
/100
|
#24
Exceptional
9.2%
Immigrants from Ireland
99.8
/100
|
#25
Exceptional
9.2%
Swedes
99.8
/100
|
#26
Exceptional
9.2%
Bhutanese
99.8
/100
|
#27
Exceptional
9.2%
Czechs
99.8
/100
|
#28
Exceptional
9.2%

Luxembourger Receiving Food Stamps Correlation Summary

MeasurementLuxembourger DataReceiving Food Stamps Data
Minimum0.026%0.57%
Maximum23.2%13.6%
Range23.1%13.1%
Mean4.4%6.0%
Median3.3%6.2%
Interquartile 25% (IQ1)1.5%3.5%
Interquartile 75% (IQ3)5.6%8.2%
Interquartile Range (IQR)4.1%4.7%
Standard Deviation (Sample)4.6%2.9%
Standard Deviation (Population)4.5%2.9%

Correlation Details

Luxembourger PercentileSample SizeReceiving Food Stamps
[
0.0%
-
0.5%
]
0.026%
133,116,08411.5%
[
0.0%
-
0.5%
]
0.18%
7,604,7298.1%
[
0.0%
-
0.5%
]
0.32%
1,614,4727.1%
[
0.0%
-
0.5%
]
0.46%
853,5965.3%
[
0.5%
-
1.0%
]
0.59%
418,6298.4%
[
0.5%
-
1.0%
]
0.72%
210,8496.6%
[
0.5%
-
1.0%
]
0.88%
169,5846.2%
[
1.0%
-
1.5%
]
1.01%
90,7606.4%
[
1.0%
-
1.5%
]
1.12%
52,8884.2%
[
1.0%
-
1.5%
]
1.27%
44,5966.2%
[
1.0%
-
1.5%
]
1.39%
108,61011.1%
[
1.5%
-
2.0%
]
1.51%
35,1297.6%
[
1.5%
-
2.0%
]
1.67%
13,1395.4%
[
1.5%
-
2.0%
]
1.81%
73,4343.2%
[
1.5%
-
2.0%
]
1.96%
9,8034.2%
[
2.0%
-
2.5%
]
2.06%
19,5448.5%
[
2.0%
-
2.5%
]
2.20%
7,91913.6%
[
2.0%
-
2.5%
]
2.35%
16,5738.8%
[
2.0%
-
2.5%
]
2.44%
6,9604.5%
[
2.5%
-
3.0%
]
2.66%
3,4268.0%
[
2.5%
-
3.0%
]
2.77%
2534.2%
[
3.0%
-
3.5%
]
3.03%
13210.0%
[
3.0%
-
3.5%
]
3.13%
1,9816.5%
[
3.0%
-
3.5%
]
3.27%
6,4816.2%
[
3.0%
-
3.5%
]
3.44%
9606.1%
[
3.5%
-
4.0%
]
3.73%
2,7115.3%
[
3.5%
-
4.0%
]
3.80%
796.0%
[
3.5%
-
4.0%
]
3.98%
5,1563.5%
[
4.0%
-
4.5%
]
4.16%
5297.1%
[
4.0%
-
4.5%
]
4.20%
2,9023.5%
[
4.0%
-
4.5%
]
4.36%
4,9078.4%
[
4.5%
-
5.0%
]
4.56%
2,4992.1%
[
4.5%
-
5.0%
]
4.67%
1,0700.57%
[
4.5%
-
5.0%
]
4.95%
1828.2%
[
4.5%
-
5.0%
]
4.99%
3,8052.7%
[
5.5%
-
6.0%
]
5.62%
4988.6%
[
5.5%
-
6.0%
]
5.88%
5,4425.2%
[
6.5%
-
7.0%
]
6.69%
1,1363.4%
[
6.5%
-
7.0%
]
6.78%
6788.5%
[
7.0%
-
7.5%
]
7.46%
3,0433.5%
[
7.5%
-
8.0%
]
7.88%
3,0962.2%
[
8.0%
-
8.5%
]
8.43%
1,28110.6%
[
8.5%
-
9.0%
]
8.69%
2,0952.5%
[
9.5%
-
10.0%
]
9.76%
3,5961.2%
[
10.5%
-
11.0%
]
10.80%
2873.2%
[
20.0%
-
20.5%
]
20.30%
1336.7%
[
23.0%
-
23.5%
]
23.16%
9931.1%