Japanese GED/Equivalency

COMPARE

Japanese
Race
Ancestry
AfghanAfricanAlaska NativeAlaskan AthabascanAlbanianAleutAlsatianAmericanApacheArabArapahoArgentineanArmenianAssyrian/Chaldean/SyriacAustralianAustrianBahamianBangladeshiBarbadianBasqueBelgianBelizeanBermudanBhutaneseBlackfeetBolivianBrazilianBritishBritish West IndianBulgarianBurmeseCajunCambodianCanadianCape VerdeanCarpatho RusynCelticCentral AmericanCentral American IndianCherokeeCheyenneChickasawChileanChineseChippewaChoctawColombianColvilleComancheCosta RicanCreeCreekCroatianCrowCubanCypriotCzechCzechoslovakianDanishDelawareDominicanDutchDutch West IndianEastern EuropeanEcuadorianEgyptianEnglishEstonianEthiopianEuropeanFijianFilipinoFinnishFrenchFrench American IndianFrench CanadianGermanGerman RussianGhanaianGreekGuamanian/ChamorroGuatemalanGuyaneseHaitianHmongHonduranHopiHoumaHungarianIcelanderIndian (Asian)IndonesianInupiatIranianIraqiIrishIroquoisIsraeliItalianJamaicanJapaneseJordanianKenyanKiowaKoreanLaotianLatvianLebaneseLiberianLithuanianLumbeeLuxembourgerMacedonianMalaysianMalteseMarshalleseMenomineeMexicanMexican American IndianMongolianMoroccanNative HawaiianNavajoNepaleseNew ZealanderNicaraguanNigerianNorthern EuropeanNorwegianOkinawanOsageOttawaPaiutePakistaniPalestinianPanamanianParaguayanPennsylvania GermanPeruvianPimaPolishPortuguesePotawatomiPuebloPuerto RicanPuget Sound SalishRomanianRussianSalvadoranSamoanScandinavianScotch-IrishScottishSeminoleSenegaleseSerbianShoshoneSierra LeoneanSiouxSlavicSlovakSloveneSomaliSouth AfricanSouth AmericanSouth American IndianSoviet UnionSpaniardSpanishSpanish AmericanSpanish American IndianSri LankanSubsaharan AfricanSudaneseSwedishSwissSyrianTaiwaneseThaiTlingit-HaidaTohono O'OdhamTonganTrinidadian and TobagonianTsimshianTurkishU.S. Virgin IslanderUgandanUkrainianUruguayanUteVenezuelanVietnameseWelshWest IndianYakamaYaquiYugoslavianYumanYup'ikZimbabwean
Immigration
NonimmigrantsImmigrantsAfghanistanAfricaAlbaniaArgentinaArmeniaAsiaAustraliaAustriaBahamasBangladeshBarbadosBelarusBelgiumBelizeBoliviaBosnia and HerzegovinaBrazilBulgariaBurma/MyanmarCabo VerdeCambodiaCameroonCanadaCaribbeanCentral AmericaChileChinaColombiaCongoCosta RicaCroatiaCubaCzechoslovakiaDenmarkDominicaDominican RepublicEastern AfricaEastern AsiaEastern EuropeEcuadorEgyptEl SalvadorEnglandEritreaEthiopiaEuropeFijiFranceGermanyGhanaGreeceGrenadaGuatemalaGuyanaHaitiHondurasHong KongHungaryIndiaIndonesiaIranIraqIrelandIsraelItalyJamaicaJapanJordanKazakhstanKenyaKoreaKuwaitLaosLatin AmericaLatviaLebanonLiberiaLithuaniaMalaysiaMexicoMicronesiaMiddle AfricaMoldovaMoroccoNepalNetherlandsNicaraguaNigeriaNorth AmericaNorth MacedoniaNorthern AfricaNorthern EuropeNorwayOceaniaPakistanPanamaPeruPhilippinesPolandPortugalRomaniaRussiaSaudi ArabiaScotlandSenegalSerbiaSierra LeoneSingaporeSomaliaSouth AfricaSouth AmericaSouth Central AsiaSouth Eastern AsiaSouthern EuropeSpainSri LankaSt. Vincent and the GrenadinesSudanSwedenSwitzerlandSyriaTaiwanThailandTrinidad and TobagoTurkeyUgandaUkraineUruguayUzbekistanVenezuelaVietnamWest IndiesWestern AfricaWestern AsiaWestern EuropeYemenZaireZimbabweAzores
Select to Compare
Race
Ancestry
AfghanAfricanAlaska NativeAlaskan AthabascanAlbanianAleutAlsatianAmericanApacheArabArapahoArgentineanArmenianAssyrian/Chaldean/SyriacAustralianAustrianBahamianBangladeshiBarbadianBasqueBelgianBelizeanBermudanBhutaneseBlackfeetBolivianBrazilianBritishBritish West IndianBulgarianBurmeseCajunCambodianCanadianCape VerdeanCarpatho RusynCelticCentral AmericanCentral American IndianCherokeeCheyenneChickasawChileanChineseChippewaChoctawColombianColvilleComancheCosta RicanCreeCreekCroatianCrowCubanCypriotCzechCzechoslovakianDanishDelawareDominicanDutchDutch West IndianEastern EuropeanEcuadorianEgyptianEnglishEstonianEthiopianEuropeanFijianFilipinoFinnishFrenchFrench American IndianFrench CanadianGermanGerman RussianGhanaianGreekGuamanian/ChamorroGuatemalanGuyaneseHaitianHmongHonduranHopiHoumaHungarianIcelanderIndian (Asian)IndonesianInupiatIranianIraqiIrishIroquoisIsraeliItalianJamaicanJordanianKenyanKiowaKoreanLaotianLatvianLebaneseLiberianLithuanianLumbeeLuxembourgerMacedonianMalaysianMalteseMarshalleseMenomineeMexicanMexican American IndianMongolianMoroccanNative HawaiianNavajoNepaleseNew ZealanderNicaraguanNigerianNorthern EuropeanNorwegianOkinawanOsageOttawaPaiutePakistaniPalestinianPanamanianParaguayanPennsylvania GermanPeruvianPimaPolishPortuguesePotawatomiPuebloPuerto RicanPuget Sound SalishRomanianRussianSalvadoranSamoanScandinavianScotch-IrishScottishSeminoleSenegaleseSerbianShoshoneSierra LeoneanSiouxSlavicSlovakSloveneSomaliSouth AfricanSouth AmericanSouth American IndianSoviet UnionSpaniardSpanishSpanish AmericanSpanish American IndianSri LankanSubsaharan AfricanSudaneseSwedishSwissSyrianTaiwaneseThaiTlingit-HaidaTohono O'OdhamTonganTrinidadian and TobagonianTsimshianTurkishU.S. Virgin IslanderUgandanUkrainianUruguayanUteVenezuelanVietnameseWelshWest IndianYakamaYaquiYugoslavianYumanYup'ikZimbabwean
Immigration
NonimmigrantsImmigrantsAfghanistanAfricaAlbaniaArgentinaArmeniaAsiaAustraliaAustriaBahamasBangladeshBarbadosBelarusBelgiumBelizeBoliviaBosnia and HerzegovinaBrazilBulgariaBurma/MyanmarCabo VerdeCambodiaCameroonCanadaCaribbeanCentral AmericaChileChinaColombiaCongoCosta RicaCroatiaCubaCzechoslovakiaDenmarkDominicaDominican RepublicEastern AfricaEastern AsiaEastern EuropeEcuadorEgyptEl SalvadorEnglandEritreaEthiopiaEuropeFijiFranceGermanyGhanaGreeceGrenadaGuatemalaGuyanaHaitiHondurasHong KongHungaryIndiaIndonesiaIranIraqIrelandIsraelItalyJamaicaJapanJordanKazakhstanKenyaKoreaKuwaitLaosLatin AmericaLatviaLebanonLiberiaLithuaniaMalaysiaMexicoMicronesiaMiddle AfricaMoldovaMoroccoNepalNetherlandsNicaraguaNigeriaNorth AmericaNorth MacedoniaNorthern AfricaNorthern EuropeNorwayOceaniaPakistanPanamaPeruPhilippinesPolandPortugalRomaniaRussiaSaudi ArabiaScotlandSenegalSerbiaSierra LeoneSingaporeSomaliaSouth AfricaSouth AmericaSouth Central AsiaSouth Eastern AsiaSouthern EuropeSpainSri LankaSt. Vincent and the GrenadinesSudanSwedenSwitzerlandSyriaTaiwanThailandTrinidad and TobagoTurkeyUgandaUkraineUruguayUzbekistanVenezuelaVietnamWest IndiesWestern AfricaWestern AsiaWestern EuropeYemenZaireZimbabweAzores
GED/Equivalency
Income
Poverty
Unemployment
Labor Participation
Family Structure
Vehicle Availability
Education Level
Disability

Japanese GED/Equivalency
Tragic

82.4%
GED/EQUIVALENCY
0.0/ 100
METRIC RATING
287th/ 347
METRIC RANK

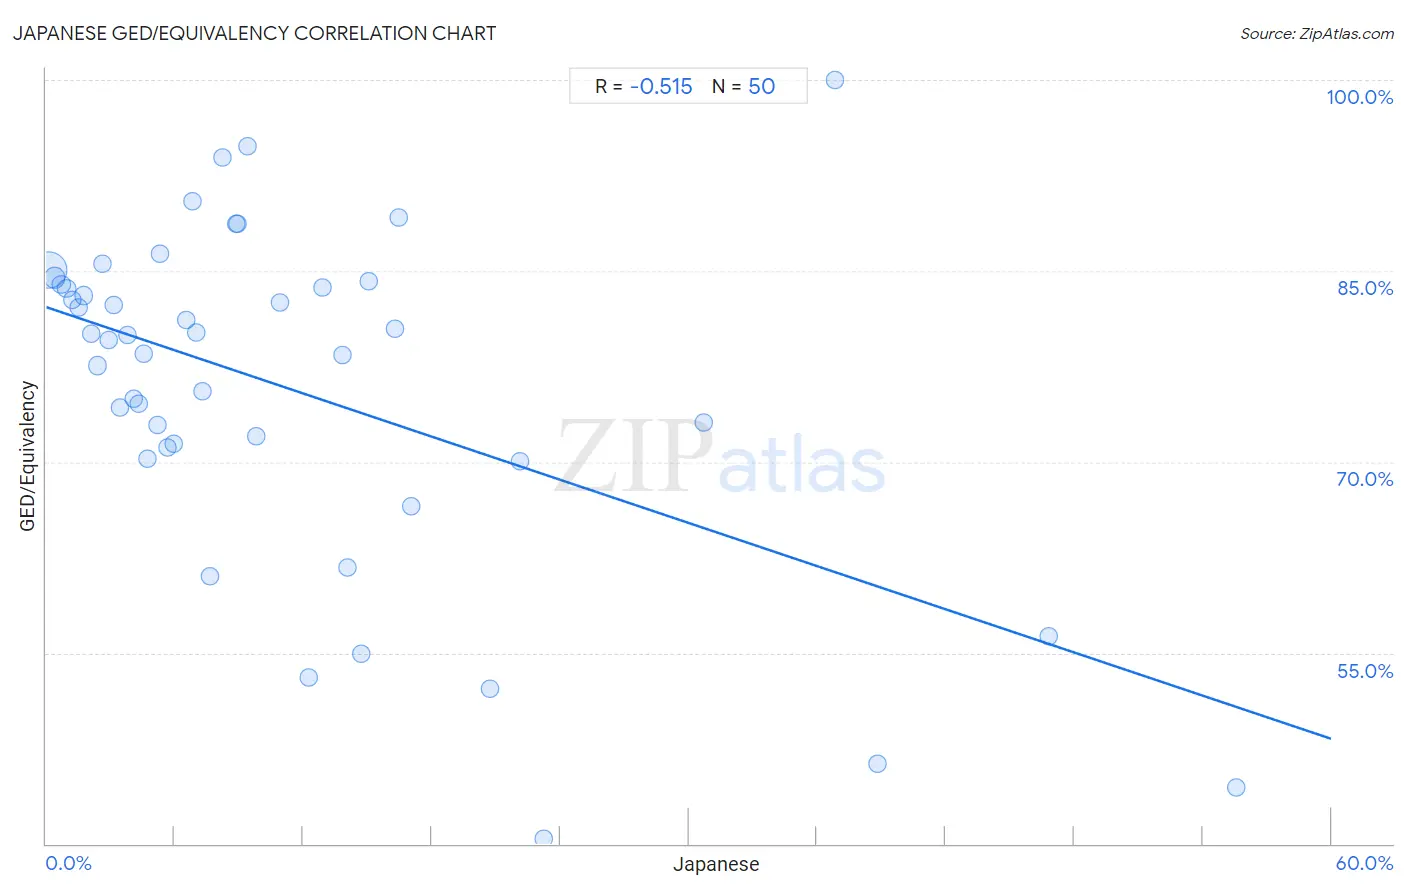
Japanese GED/Equivalency Correlation Chart

The statistical analysis conducted on geographies consisting of 249,183,224 people shows a substantial negative correlation between the proportion of Japanese and percentage of population with at least ged/equivalency education in the United States with a correlation coefficient (R) of -0.515 and weighted average of 82.4%. On average, for every 1% (one percent) increase in Japanese within a typical geography, there is a decrease of 0.57% in percentage of population with at least ged/equivalency education.
Japanese GED/Equivalency
It is essential to understand that the correlation between the percentage of Japanese and percentage of population with at least ged/equivalency education does not imply a direct cause-and-effect relationship. It remains uncertain whether the presence of Japanese influences an upward or downward trend in the level of percentage of population with at least ged/equivalency education within an area, or if Japanese simply ended up residing in those areas with higher or lower levels of percentage of population with at least ged/equivalency education due to other factors.

Demographics Similar to Japanese by GED/Equivalency

In terms of ged/equivalency, the demographic groups most similar to Japanese are Immigrants from West Indies (82.4%, a difference of 0.020%), Cajun (82.4%, a difference of 0.040%), Immigrants from Barbados (82.4%, a difference of 0.070%), Pueblo (82.3%, a difference of 0.10%), and Immigrants from Cambodia (82.2%, a difference of 0.18%).
DemographicsRating | RankGED/Equivalency
Cheyenne
0.1
/100
|
#280
Tragic
82.7%
Sioux
0.1
/100
|
#281
Tragic
82.6%
Immigrants
0.1
/100
|
#282
Tragic
82.6%
Indonesians
0.1
/100
|
#283
Tragic
82.5%
Immigrants from Barbados
0.1
/100
|
#284
Tragic
82.4%
Cajuns
0.0
/100
|
#285
Tragic
82.4%
Immigrants from West Indies
0.0
/100
|
#286
Tragic
82.4%
Japanese
0.0
/100
|
#287
Tragic
82.4%
Pueblo
0.0
/100
|
#288
Tragic
82.3%
Immigrants from Cambodia
0.0
/100
|
#289
Tragic
82.2%
Haitians
0.0
/100
|
#290
Tragic
82.1%
Cubans
0.0
/100
|
#291
Tragic
82.0%
Paiute
0.0
/100
|
#292
Tragic
82.0%
British West Indians
0.0
/100
|
#293
Tragic
82.0%
Immigrants from St. Vincent and the Grenadines
0.0
/100
|
#294
Tragic
82.0%

Japanese GED/Equivalency Correlation Summary

MeasurementJapanese DataGED/Equivalency Data
Minimum0.089%40.4%
Maximum55.6%100.0%
Range55.5%59.6%
Mean11.3%75.8%
Median7.1%79.8%
Interquartile 25% (IQ1)3.4%71.1%
Interquartile 75% (IQ3)14.7%83.9%
Interquartile Range (IQR)11.3%12.8%
Standard Deviation (Sample)12.1%13.3%
Standard Deviation (Population)12.0%13.1%

Correlation Details

Japanese PercentileSample SizeGED/Equivalency
[
0.0%
-
0.5%
]
0.089%
191,228,79885.0%
[
0.0%
-
0.5%
]
0.39%
32,064,61884.4%
[
0.5%
-
1.0%
]
0.68%
11,053,02583.9%
[
0.5%
-
1.0%
]
0.95%
5,586,56983.6%
[
1.0%
-
1.5%
]
1.23%
2,875,17782.7%
[
1.5%
-
2.0%
]
1.51%
1,549,68582.2%
[
1.5%
-
2.0%
]
1.77%
1,269,77083.1%
[
2.0%
-
2.5%
]
2.09%
537,39280.1%
[
2.0%
-
2.5%
]
2.37%
401,59677.6%
[
2.5%
-
3.0%
]
2.64%
83,84885.6%
[
2.5%
-
3.0%
]
2.93%
184,19279.5%
[
3.0%
-
3.5%
]
3.15%
208,25682.3%
[
3.0%
-
3.5%
]
3.43%
147,54574.3%
[
3.5%
-
4.0%
]
3.81%
638,20980.0%
[
4.0%
-
4.5%
]
4.08%
60,10774.9%
[
4.0%
-
4.5%
]
4.30%
473,88274.6%
[
4.5%
-
5.0%
]
4.57%
68,00878.4%
[
4.5%
-
5.0%
]
4.73%
74,69570.2%
[
5.0%
-
5.5%
]
5.21%
41,24072.9%
[
5.0%
-
5.5%
]
5.34%
5,60086.3%
[
5.5%
-
6.0%
]
5.64%
104,25171.1%
[
5.5%
-
6.0%
]
5.96%
70,81871.4%
[
6.5%
-
7.0%
]
6.54%
65,60881.2%
[
6.5%
-
7.0%
]
6.83%
27890.5%
[
6.5%
-
7.0%
]
6.99%
41,00180.2%
[
7.0%
-
7.5%
]
7.29%
64575.6%
[
7.5%
-
8.0%
]
7.63%
59,15361.1%
[
8.0%
-
8.5%
]
8.23%
4,14593.9%
[
8.5%
-
9.0%
]
8.84%
12,32488.7%
[
8.5%
-
9.0%
]
8.91%
11,67888.7%
[
9.0%
-
9.5%
]
9.38%
2,91194.8%
[
9.5%
-
10.0%
]
9.81%
59,46072.0%
[
10.5%
-
11.0%
]
10.92%
27,84882.5%
[
12.0%
-
12.5%
]
12.25%
2,58853.1%
[
12.5%
-
13.0%
]
12.88%
13283.7%
[
13.5%
-
14.0%
]
13.86%
114,73778.4%
[
14.0%
-
14.5%
]
14.08%
1,36461.7%
[
14.5%
-
15.0%
]
14.72%
2,21555.0%
[
15.0%
-
15.5%
]
15.03%
32684.2%
[
16.0%
-
16.5%
]
16.30%
41180.5%
[
16.0%
-
16.5%
]
16.47%
86889.2%
[
17.0%
-
17.5%
]
17.03%
7,11866.5%
[
20.5%
-
21.0%
]
20.70%
1,57552.1%
[
22.0%
-
22.5%
]
22.12%
5,47870.0%
[
23.0%
-
23.5%
]
23.24%
92140.4%
[
30.5%
-
31.0%
]
30.73%
32,32373.1%
[
36.5%
-
37.0%
]
36.86%
388100.0%
[
38.5%
-
39.0%
]
38.81%
21946.3%
[
46.5%
-
47.0%
]
46.82%
22056.3%
[
55.5%
-
56.0%
]
55.56%
944.4%