Japanese Married-Couple Family Poverty

COMPARE

Japanese
Race
Ancestry
AfghanAfricanAlaska NativeAlaskan AthabascanAlbanianAleutAlsatianAmericanApacheArabArapahoArgentineanArmenianAssyrian/Chaldean/SyriacAustralianAustrianBahamianBangladeshiBarbadianBasqueBelgianBelizeanBermudanBhutaneseBlackfeetBolivianBrazilianBritishBritish West IndianBulgarianBurmeseCajunCambodianCanadianCape VerdeanCarpatho RusynCelticCentral AmericanCentral American IndianCherokeeCheyenneChickasawChileanChineseChippewaChoctawColombianColvilleComancheCosta RicanCreeCreekCroatianCrowCubanCypriotCzechCzechoslovakianDanishDelawareDominicanDutchDutch West IndianEastern EuropeanEcuadorianEgyptianEnglishEstonianEthiopianEuropeanFijianFilipinoFinnishFrenchFrench American IndianFrench CanadianGermanGerman RussianGhanaianGreekGuamanian/ChamorroGuatemalanGuyaneseHaitianHmongHonduranHopiHoumaHungarianIcelanderIndian (Asian)IndonesianInupiatIranianIraqiIrishIroquoisIsraeliItalianJamaicanJapaneseJordanianKenyanKiowaKoreanLaotianLatvianLebaneseLiberianLithuanianLumbeeLuxembourgerMacedonianMalaysianMalteseMarshalleseMenomineeMexicanMexican American IndianMongolianMoroccanNative HawaiianNavajoNepaleseNew ZealanderNicaraguanNigerianNorthern EuropeanNorwegianOkinawanOsageOttawaPaiutePakistaniPalestinianPanamanianParaguayanPennsylvania GermanPeruvianPimaPolishPortuguesePotawatomiPuebloPuerto RicanPuget Sound SalishRomanianRussianSalvadoranSamoanScandinavianScotch-IrishScottishSeminoleSenegaleseSerbianShoshoneSierra LeoneanSiouxSlavicSlovakSloveneSomaliSouth AfricanSouth AmericanSouth American IndianSoviet UnionSpaniardSpanishSpanish AmericanSpanish American IndianSri LankanSubsaharan AfricanSudaneseSwedishSwissSyrianTaiwaneseThaiTlingit-HaidaTohono O'OdhamTonganTrinidadian and TobagonianTsimshianTurkishU.S. Virgin IslanderUgandanUkrainianUruguayanUteVenezuelanVietnameseWelshWest IndianYakamaYaquiYugoslavianYumanYup'ikZimbabwean
Immigration
NonimmigrantsImmigrantsAfghanistanAfricaAlbaniaArgentinaArmeniaAsiaAustraliaAustriaBahamasBangladeshBarbadosBelarusBelgiumBelizeBoliviaBosnia and HerzegovinaBrazilBulgariaBurma/MyanmarCabo VerdeCambodiaCameroonCanadaCaribbeanCentral AmericaChileChinaColombiaCongoCosta RicaCroatiaCubaCzechoslovakiaDenmarkDominicaDominican RepublicEastern AfricaEastern AsiaEastern EuropeEcuadorEgyptEl SalvadorEnglandEritreaEthiopiaEuropeFijiFranceGermanyGhanaGreeceGrenadaGuatemalaGuyanaHaitiHondurasHong KongHungaryIndiaIndonesiaIranIraqIrelandIsraelItalyJamaicaJapanJordanKazakhstanKenyaKoreaKuwaitLaosLatin AmericaLatviaLebanonLiberiaLithuaniaMalaysiaMexicoMicronesiaMiddle AfricaMoldovaMoroccoNepalNetherlandsNicaraguaNigeriaNorth AmericaNorth MacedoniaNorthern AfricaNorthern EuropeNorwayOceaniaPakistanPanamaPeruPhilippinesPolandPortugalRomaniaRussiaSaudi ArabiaScotlandSenegalSerbiaSierra LeoneSingaporeSomaliaSouth AfricaSouth AmericaSouth Central AsiaSouth Eastern AsiaSouthern EuropeSpainSri LankaSt. Vincent and the GrenadinesSudanSwedenSwitzerlandSyriaTaiwanThailandTrinidad and TobagoTurkeyUgandaUkraineUruguayUzbekistanVenezuelaVietnamWest IndiesWestern AfricaWestern AsiaWestern EuropeYemenZaireZimbabweAzores
Select to Compare
Race
Ancestry
AfghanAfricanAlaska NativeAlaskan AthabascanAlbanianAleutAlsatianAmericanApacheArabArapahoArgentineanArmenianAssyrian/Chaldean/SyriacAustralianAustrianBahamianBangladeshiBarbadianBasqueBelgianBelizeanBermudanBhutaneseBlackfeetBolivianBrazilianBritishBritish West IndianBulgarianBurmeseCajunCambodianCanadianCape VerdeanCarpatho RusynCelticCentral AmericanCentral American IndianCherokeeCheyenneChickasawChileanChineseChippewaChoctawColombianColvilleComancheCosta RicanCreeCreekCroatianCrowCubanCypriotCzechCzechoslovakianDanishDelawareDominicanDutchDutch West IndianEastern EuropeanEcuadorianEgyptianEnglishEstonianEthiopianEuropeanFijianFilipinoFinnishFrenchFrench American IndianFrench CanadianGermanGerman RussianGhanaianGreekGuamanian/ChamorroGuatemalanGuyaneseHaitianHmongHonduranHopiHoumaHungarianIcelanderIndian (Asian)IndonesianInupiatIranianIraqiIrishIroquoisIsraeliItalianJamaicanJordanianKenyanKiowaKoreanLaotianLatvianLebaneseLiberianLithuanianLumbeeLuxembourgerMacedonianMalaysianMalteseMarshalleseMenomineeMexicanMexican American IndianMongolianMoroccanNative HawaiianNavajoNepaleseNew ZealanderNicaraguanNigerianNorthern EuropeanNorwegianOkinawanOsageOttawaPaiutePakistaniPalestinianPanamanianParaguayanPennsylvania GermanPeruvianPimaPolishPortuguesePotawatomiPuebloPuerto RicanPuget Sound SalishRomanianRussianSalvadoranSamoanScandinavianScotch-IrishScottishSeminoleSenegaleseSerbianShoshoneSierra LeoneanSiouxSlavicSlovakSloveneSomaliSouth AfricanSouth AmericanSouth American IndianSoviet UnionSpaniardSpanishSpanish AmericanSpanish American IndianSri LankanSubsaharan AfricanSudaneseSwedishSwissSyrianTaiwaneseThaiTlingit-HaidaTohono O'OdhamTonganTrinidadian and TobagonianTsimshianTurkishU.S. Virgin IslanderUgandanUkrainianUruguayanUteVenezuelanVietnameseWelshWest IndianYakamaYaquiYugoslavianYumanYup'ikZimbabwean
Immigration
NonimmigrantsImmigrantsAfghanistanAfricaAlbaniaArgentinaArmeniaAsiaAustraliaAustriaBahamasBangladeshBarbadosBelarusBelgiumBelizeBoliviaBosnia and HerzegovinaBrazilBulgariaBurma/MyanmarCabo VerdeCambodiaCameroonCanadaCaribbeanCentral AmericaChileChinaColombiaCongoCosta RicaCroatiaCubaCzechoslovakiaDenmarkDominicaDominican RepublicEastern AfricaEastern AsiaEastern EuropeEcuadorEgyptEl SalvadorEnglandEritreaEthiopiaEuropeFijiFranceGermanyGhanaGreeceGrenadaGuatemalaGuyanaHaitiHondurasHong KongHungaryIndiaIndonesiaIranIraqIrelandIsraelItalyJamaicaJapanJordanKazakhstanKenyaKoreaKuwaitLaosLatin AmericaLatviaLebanonLiberiaLithuaniaMalaysiaMexicoMicronesiaMiddle AfricaMoldovaMoroccoNepalNetherlandsNicaraguaNigeriaNorth AmericaNorth MacedoniaNorthern AfricaNorthern EuropeNorwayOceaniaPakistanPanamaPeruPhilippinesPolandPortugalRomaniaRussiaSaudi ArabiaScotlandSenegalSerbiaSierra LeoneSingaporeSomaliaSouth AfricaSouth AmericaSouth Central AsiaSouth Eastern AsiaSouthern EuropeSpainSri LankaSt. Vincent and the GrenadinesSudanSwedenSwitzerlandSyriaTaiwanThailandTrinidad and TobagoTurkeyUgandaUkraineUruguayUzbekistanVenezuelaVietnamWest IndiesWestern AfricaWestern AsiaWestern EuropeYemenZaireZimbabweAzores
Married-Couple Family Poverty
Income
Poverty
Unemployment
Labor Participation
Family Structure
Vehicle Availability
Education Level
Disability

Japanese Married-Couple Family Poverty
Tragic

5.6%
POVERTY | MARRIED-COUPLE FAMILIES
9.8/ 100
METRIC RATING
219th/ 347
METRIC RANK

Japanese Married-Couple Family Poverty Correlation Chart

The statistical analysis conducted on geographies consisting of 247,969,020 people shows a substantial positive correlation between the proportion of Japanese and poverty level among married-couple families in the United States with a correlation coefficient (R) of 0.564 and weighted average of 5.6%. On average, for every 1% (one percent) increase in Japanese within a typical geography, there is an increase of 0.48% in poverty level among married-couple families.
Japanese Married-Couple Family Poverty
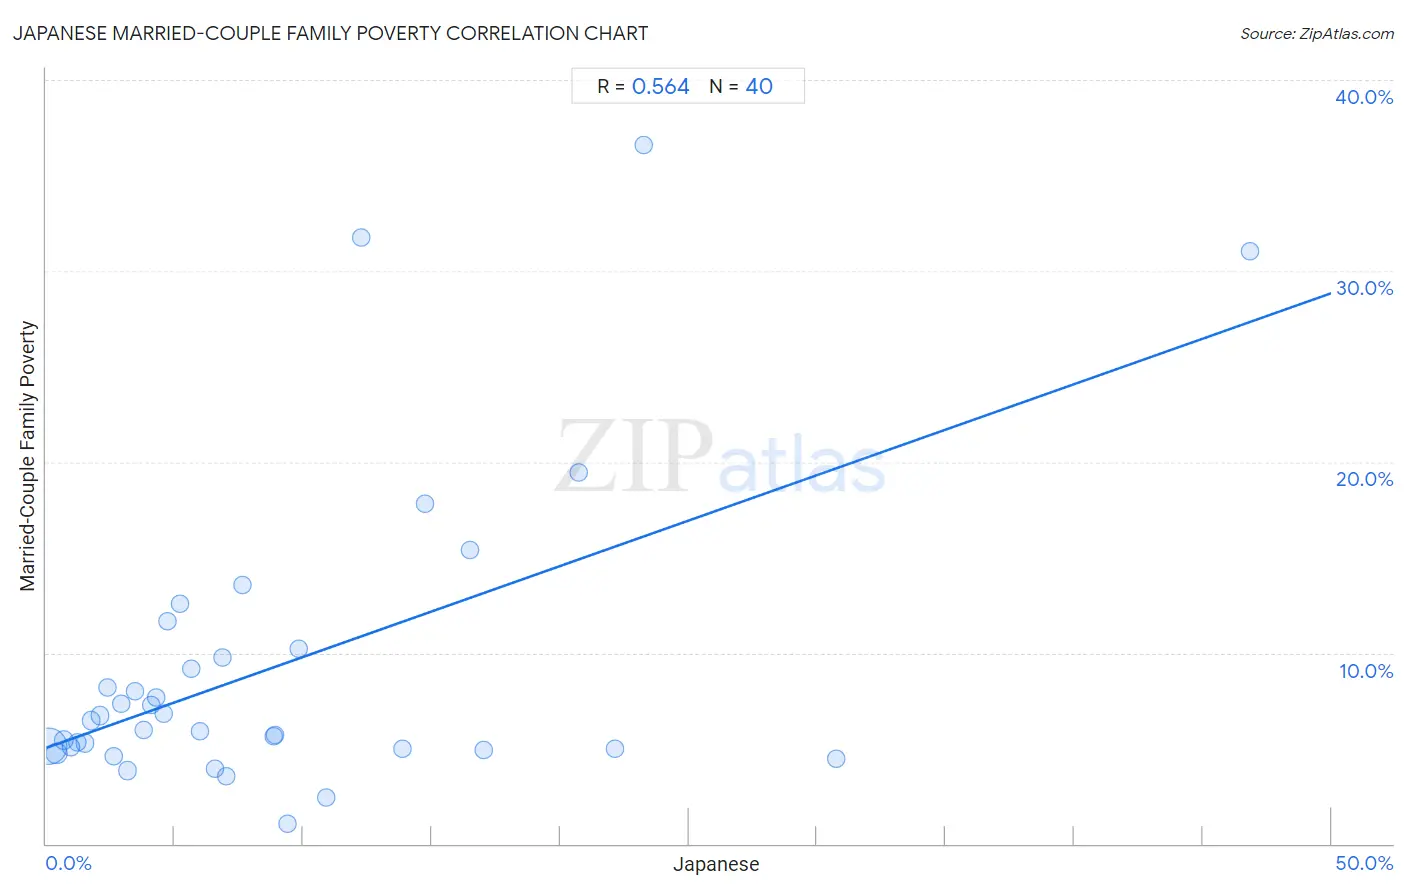
It is essential to understand that the correlation between the percentage of Japanese and poverty level among married-couple families does not imply a direct cause-and-effect relationship. It remains uncertain whether the presence of Japanese influences an upward or downward trend in the level of poverty level among married-couple families within an area, or if Japanese simply ended up residing in those areas with higher or lower levels of poverty level among married-couple families due to other factors.

Demographics Similar to Japanese by Married-Couple Family Poverty

In terms of married-couple family poverty, the demographic groups most similar to Japanese are Colombian (5.6%, a difference of 0.19%), Panamanian (5.6%, a difference of 0.21%), Afghan (5.5%, a difference of 0.40%), Immigrants from Nigeria (5.5%, a difference of 0.42%), and Potawatomi (5.5%, a difference of 0.71%).
DemographicsRating | RankMarried-Couple Family Poverty
Immigrants from Thailand
14.0
/100
|
#212
Poor
5.5%
Immigrants from Liberia
13.3
/100
|
#213
Poor
5.5%
Iroquois
13.1
/100
|
#214
Poor
5.5%
Armenians
12.8
/100
|
#215
Poor
5.5%
Potawatomi
12.4
/100
|
#216
Poor
5.5%
Immigrants from Nigeria
11.3
/100
|
#217
Poor
5.5%
Afghans
11.2
/100
|
#218
Poor
5.5%
Japanese
9.8
/100
|
#219
Tragic
5.6%
Colombians
9.2
/100
|
#220
Tragic
5.6%
Panamanians
9.2
/100
|
#221
Tragic
5.6%
Cajuns
6.9
/100
|
#222
Tragic
5.6%
Immigrants from Fiji
6.7
/100
|
#223
Tragic
5.6%
Sudanese
6.4
/100
|
#224
Tragic
5.6%
Immigrants from Cambodia
6.1
/100
|
#225
Tragic
5.6%
South Americans
5.7
/100
|
#226
Tragic
5.6%

Japanese Married-Couple Family Poverty Correlation Summary

MeasurementJapanese DataMarried-Couple Family Poverty Data
Minimum0.089%1.1%
Maximum46.8%36.6%
Range46.7%35.5%
Mean8.9%9.3%
Median5.8%6.2%
Interquartile 25% (IQ1)2.8%5.0%
Interquartile 75% (IQ3)11.6%10.0%
Interquartile Range (IQR)8.8%5.0%
Standard Deviation (Sample)9.4%8.0%
Standard Deviation (Population)9.3%7.9%

Correlation Details

Japanese PercentileSample SizeMarried-Couple Family Poverty
[
0.0%
-
0.5%
]
0.089%
190,634,1175.1%
[
0.0%
-
0.5%
]
0.39%
31,868,9574.7%
[
0.5%
-
1.0%
]
0.68%
10,888,8525.4%
[
0.5%
-
1.0%
]
0.95%
5,519,0225.1%
[
1.0%
-
1.5%
]
1.23%
2,813,2405.3%
[
1.5%
-
2.0%
]
1.51%
1,527,4035.3%
[
1.5%
-
2.0%
]
1.77%
1,252,0776.5%
[
2.0%
-
2.5%
]
2.09%
532,7286.7%
[
2.0%
-
2.5%
]
2.37%
389,1258.2%
[
2.5%
-
3.0%
]
2.64%
81,3134.6%
[
2.5%
-
3.0%
]
2.94%
164,8507.4%
[
3.0%
-
3.5%
]
3.14%
204,2773.8%
[
3.0%
-
3.5%
]
3.43%
147,5458.0%
[
3.5%
-
4.0%
]
3.81%
630,8186.0%
[
4.0%
-
4.5%
]
4.10%
48,2157.3%
[
4.0%
-
4.5%
]
4.30%
473,8827.7%
[
4.5%
-
5.0%
]
4.57%
65,9806.8%
[
4.5%
-
5.0%
]
4.72%
72,04611.6%
[
5.0%
-
5.5%
]
5.21%
41,24012.5%
[
5.5%
-
6.0%
]
5.64%
103,4219.1%
[
5.5%
-
6.0%
]
5.97%
67,6745.9%
[
6.5%
-
7.0%
]
6.54%
65,6083.9%
[
6.5%
-
7.0%
]
6.83%
2789.8%
[
6.5%
-
7.0%
]
6.99%
41,0013.6%
[
7.5%
-
8.0%
]
7.64%
53,64713.6%
[
8.5%
-
9.0%
]
8.85%
11,7645.6%
[
8.5%
-
9.0%
]
8.91%
11,6785.7%
[
9.0%
-
9.5%
]
9.38%
2,9111.1%
[
9.5%
-
10.0%
]
9.81%
59,46010.2%
[
10.5%
-
11.0%
]
10.92%
27,8482.5%
[
12.0%
-
12.5%
]
12.25%
2,58831.8%
[
13.5%
-
14.0%
]
13.86%
114,7375.0%
[
14.5%
-
15.0%
]
14.72%
2,21517.8%
[
16.0%
-
16.5%
]
16.47%
86815.4%
[
17.0%
-
17.5%
]
17.03%
7,1184.9%
[
20.5%
-
21.0%
]
20.70%
1,57519.5%
[
22.0%
-
22.5%
]
22.12%
5,4785.0%
[
23.0%
-
23.5%
]
23.24%
92136.6%
[
30.5%
-
31.0%
]
30.73%
32,3234.5%
[
46.5%
-
47.0%
]
46.82%
22031.0%