Japanese College, Under 1 year

COMPARE

Japanese
Race
Ancestry
AfghanAfricanAlaska NativeAlaskan AthabascanAlbanianAleutAlsatianAmericanApacheArabArapahoArgentineanArmenianAssyrian/Chaldean/SyriacAustralianAustrianBahamianBangladeshiBarbadianBasqueBelgianBelizeanBermudanBhutaneseBlackfeetBolivianBrazilianBritishBritish West IndianBulgarianBurmeseCajunCambodianCanadianCape VerdeanCarpatho RusynCelticCentral AmericanCentral American IndianCherokeeCheyenneChickasawChileanChineseChippewaChoctawColombianColvilleComancheCosta RicanCreeCreekCroatianCrowCubanCypriotCzechCzechoslovakianDanishDelawareDominicanDutchDutch West IndianEastern EuropeanEcuadorianEgyptianEnglishEstonianEthiopianEuropeanFijianFilipinoFinnishFrenchFrench American IndianFrench CanadianGermanGerman RussianGhanaianGreekGuamanian/ChamorroGuatemalanGuyaneseHaitianHmongHonduranHopiHoumaHungarianIcelanderIndian (Asian)IndonesianInupiatIranianIraqiIrishIroquoisIsraeliItalianJamaicanJapaneseJordanianKenyanKiowaKoreanLaotianLatvianLebaneseLiberianLithuanianLumbeeLuxembourgerMacedonianMalaysianMalteseMarshalleseMenomineeMexicanMexican American IndianMongolianMoroccanNative HawaiianNavajoNepaleseNew ZealanderNicaraguanNigerianNorthern EuropeanNorwegianOkinawanOsageOttawaPaiutePakistaniPalestinianPanamanianParaguayanPennsylvania GermanPeruvianPimaPolishPortuguesePotawatomiPuebloPuerto RicanPuget Sound SalishRomanianRussianSalvadoranSamoanScandinavianScotch-IrishScottishSeminoleSenegaleseSerbianShoshoneSierra LeoneanSiouxSlavicSlovakSloveneSomaliSouth AfricanSouth AmericanSouth American IndianSoviet UnionSpaniardSpanishSpanish AmericanSpanish American IndianSri LankanSubsaharan AfricanSudaneseSwedishSwissSyrianTaiwaneseThaiTlingit-HaidaTohono O'OdhamTonganTrinidadian and TobagonianTsimshianTurkishU.S. Virgin IslanderUgandanUkrainianUruguayanUteVenezuelanVietnameseWelshWest IndianYakamaYaquiYugoslavianYumanYup'ikZimbabwean
Immigration
NonimmigrantsImmigrantsAfghanistanAfricaAlbaniaArgentinaArmeniaAsiaAustraliaAustriaBahamasBangladeshBarbadosBelarusBelgiumBelizeBoliviaBosnia and HerzegovinaBrazilBulgariaBurma/MyanmarCabo VerdeCambodiaCameroonCanadaCaribbeanCentral AmericaChileChinaColombiaCongoCosta RicaCroatiaCubaCzechoslovakiaDenmarkDominicaDominican RepublicEastern AfricaEastern AsiaEastern EuropeEcuadorEgyptEl SalvadorEnglandEritreaEthiopiaEuropeFijiFranceGermanyGhanaGreeceGrenadaGuatemalaGuyanaHaitiHondurasHong KongHungaryIndiaIndonesiaIranIraqIrelandIsraelItalyJamaicaJapanJordanKazakhstanKenyaKoreaKuwaitLaosLatin AmericaLatviaLebanonLiberiaLithuaniaMalaysiaMexicoMicronesiaMiddle AfricaMoldovaMoroccoNepalNetherlandsNicaraguaNigeriaNorth AmericaNorth MacedoniaNorthern AfricaNorthern EuropeNorwayOceaniaPakistanPanamaPeruPhilippinesPolandPortugalRomaniaRussiaSaudi ArabiaScotlandSenegalSerbiaSierra LeoneSingaporeSomaliaSouth AfricaSouth AmericaSouth Central AsiaSouth Eastern AsiaSouthern EuropeSpainSri LankaSt. Vincent and the GrenadinesSudanSwedenSwitzerlandSyriaTaiwanThailandTrinidad and TobagoTurkeyUgandaUkraineUruguayUzbekistanVenezuelaVietnamWest IndiesWestern AfricaWestern AsiaWestern EuropeYemenZaireZimbabweAzores
Select to Compare
Race
Ancestry
AfghanAfricanAlaska NativeAlaskan AthabascanAlbanianAleutAlsatianAmericanApacheArabArapahoArgentineanArmenianAssyrian/Chaldean/SyriacAustralianAustrianBahamianBangladeshiBarbadianBasqueBelgianBelizeanBermudanBhutaneseBlackfeetBolivianBrazilianBritishBritish West IndianBulgarianBurmeseCajunCambodianCanadianCape VerdeanCarpatho RusynCelticCentral AmericanCentral American IndianCherokeeCheyenneChickasawChileanChineseChippewaChoctawColombianColvilleComancheCosta RicanCreeCreekCroatianCrowCubanCypriotCzechCzechoslovakianDanishDelawareDominicanDutchDutch West IndianEastern EuropeanEcuadorianEgyptianEnglishEstonianEthiopianEuropeanFijianFilipinoFinnishFrenchFrench American IndianFrench CanadianGermanGerman RussianGhanaianGreekGuamanian/ChamorroGuatemalanGuyaneseHaitianHmongHonduranHopiHoumaHungarianIcelanderIndian (Asian)IndonesianInupiatIranianIraqiIrishIroquoisIsraeliItalianJamaicanJordanianKenyanKiowaKoreanLaotianLatvianLebaneseLiberianLithuanianLumbeeLuxembourgerMacedonianMalaysianMalteseMarshalleseMenomineeMexicanMexican American IndianMongolianMoroccanNative HawaiianNavajoNepaleseNew ZealanderNicaraguanNigerianNorthern EuropeanNorwegianOkinawanOsageOttawaPaiutePakistaniPalestinianPanamanianParaguayanPennsylvania GermanPeruvianPimaPolishPortuguesePotawatomiPuebloPuerto RicanPuget Sound SalishRomanianRussianSalvadoranSamoanScandinavianScotch-IrishScottishSeminoleSenegaleseSerbianShoshoneSierra LeoneanSiouxSlavicSlovakSloveneSomaliSouth AfricanSouth AmericanSouth American IndianSoviet UnionSpaniardSpanishSpanish AmericanSpanish American IndianSri LankanSubsaharan AfricanSudaneseSwedishSwissSyrianTaiwaneseThaiTlingit-HaidaTohono O'OdhamTonganTrinidadian and TobagonianTsimshianTurkishU.S. Virgin IslanderUgandanUkrainianUruguayanUteVenezuelanVietnameseWelshWest IndianYakamaYaquiYugoslavianYumanYup'ikZimbabwean
Immigration
NonimmigrantsImmigrantsAfghanistanAfricaAlbaniaArgentinaArmeniaAsiaAustraliaAustriaBahamasBangladeshBarbadosBelarusBelgiumBelizeBoliviaBosnia and HerzegovinaBrazilBulgariaBurma/MyanmarCabo VerdeCambodiaCameroonCanadaCaribbeanCentral AmericaChileChinaColombiaCongoCosta RicaCroatiaCubaCzechoslovakiaDenmarkDominicaDominican RepublicEastern AfricaEastern AsiaEastern EuropeEcuadorEgyptEl SalvadorEnglandEritreaEthiopiaEuropeFijiFranceGermanyGhanaGreeceGrenadaGuatemalaGuyanaHaitiHondurasHong KongHungaryIndiaIndonesiaIranIraqIrelandIsraelItalyJamaicaJapanJordanKazakhstanKenyaKoreaKuwaitLaosLatin AmericaLatviaLebanonLiberiaLithuaniaMalaysiaMexicoMicronesiaMiddle AfricaMoldovaMoroccoNepalNetherlandsNicaraguaNigeriaNorth AmericaNorth MacedoniaNorthern AfricaNorthern EuropeNorwayOceaniaPakistanPanamaPeruPhilippinesPolandPortugalRomaniaRussiaSaudi ArabiaScotlandSenegalSerbiaSierra LeoneSingaporeSomaliaSouth AfricaSouth AmericaSouth Central AsiaSouth Eastern AsiaSouthern EuropeSpainSri LankaSt. Vincent and the GrenadinesSudanSwedenSwitzerlandSyriaTaiwanThailandTrinidad and TobagoTurkeyUgandaUkraineUruguayUzbekistanVenezuelaVietnamWest IndiesWestern AfricaWestern AsiaWestern EuropeYemenZaireZimbabweAzores
College, Under 1 year
Income
Poverty
Unemployment
Labor Participation
Family Structure
Vehicle Availability
Education Level
Disability

Japanese College, Under 1 year
Tragic

61.5%
COLLEGE, UNDER 1 YEAR
0.4/ 100
METRIC RATING
253rd/ 347
METRIC RANK

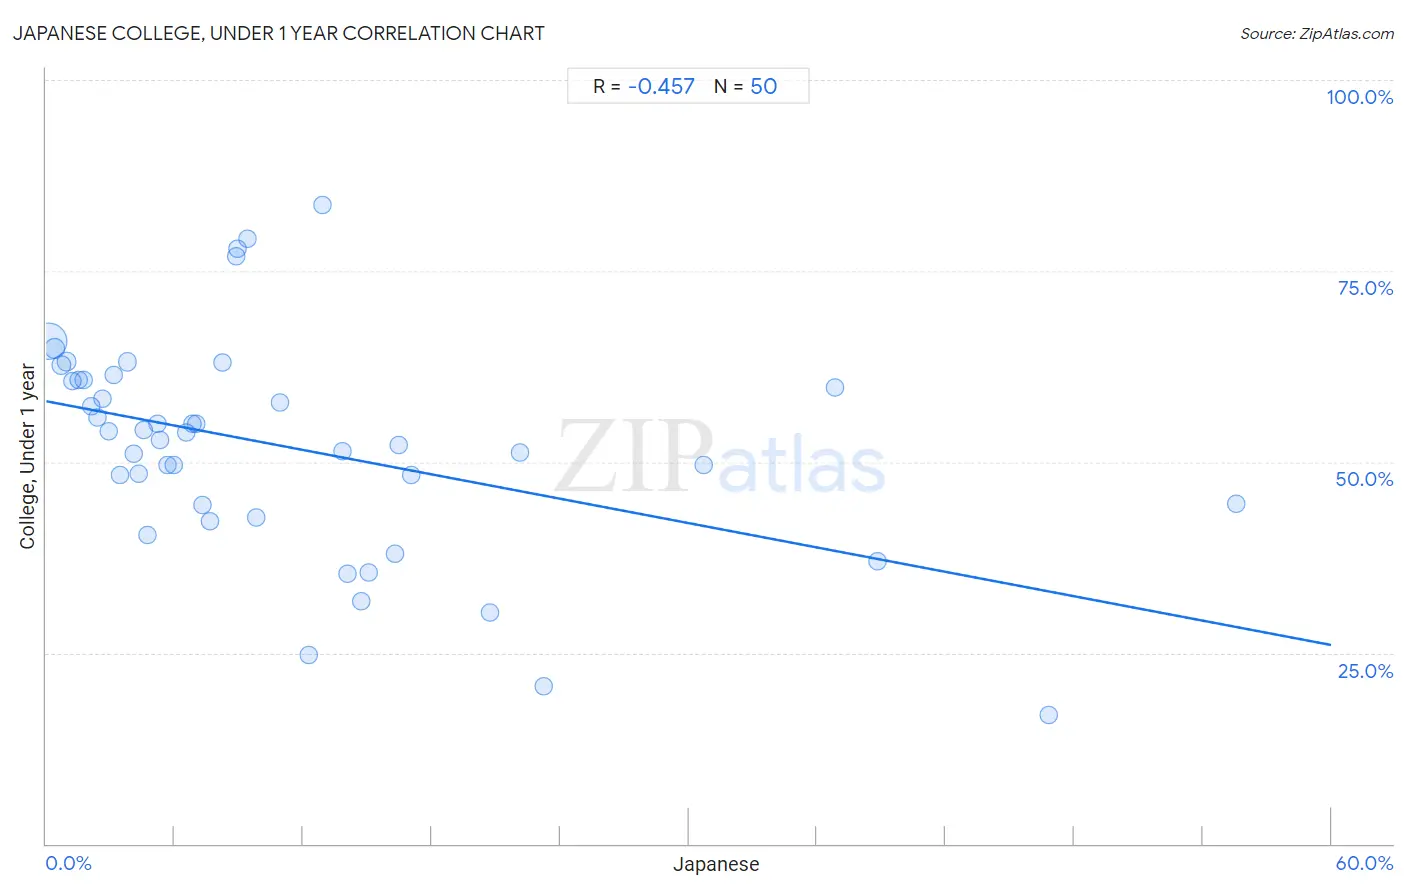
Japanese College, Under 1 year Correlation Chart

The statistical analysis conducted on geographies consisting of 249,181,552 people shows a moderate negative correlation between the proportion of Japanese and percentage of population with at least college, under 1 year education in the United States with a correlation coefficient (R) of -0.457 and weighted average of 61.5%. On average, for every 1% (one percent) increase in Japanese within a typical geography, there is a decrease of 0.53% in percentage of population with at least college, under 1 year education.
Japanese College, Under 1 year
It is essential to understand that the correlation between the percentage of Japanese and percentage of population with at least college, under 1 year education does not imply a direct cause-and-effect relationship. It remains uncertain whether the presence of Japanese influences an upward or downward trend in the level of percentage of population with at least college, under 1 year education within an area, or if Japanese simply ended up residing in those areas with higher or lower levels of percentage of population with at least college, under 1 year education due to other factors.

Demographics Similar to Japanese by College, Under 1 year

In terms of college, under 1 year, the demographic groups most similar to Japanese are West Indian (61.5%, a difference of 0.0%), Immigrants from Cambodia (61.5%, a difference of 0.0%), Immigrants from Micronesia (61.5%, a difference of 0.11%), Comanche (61.4%, a difference of 0.13%), and Bangladeshi (61.4%, a difference of 0.17%).
DemographicsRating | RankCollege, Under 1 year
Marshallese
0.8
/100
|
#246
Tragic
61.9%
Immigrants from Liberia
0.8
/100
|
#247
Tragic
61.9%
Potawatomi
0.6
/100
|
#248
Tragic
61.8%
Vietnamese
0.5
/100
|
#249
Tragic
61.7%
Immigrants from Congo
0.5
/100
|
#250
Tragic
61.7%
Immigrants from Micronesia
0.5
/100
|
#251
Tragic
61.5%
West Indians
0.4
/100
|
#252
Tragic
61.5%
Japanese
0.4
/100
|
#253
Tragic
61.5%
Immigrants from Cambodia
0.4
/100
|
#254
Tragic
61.5%
Comanche
0.4
/100
|
#255
Tragic
61.4%
Bangladeshis
0.4
/100
|
#256
Tragic
61.4%
Immigrants from Laos
0.3
/100
|
#257
Tragic
61.3%
Immigrants from Bangladesh
0.3
/100
|
#258
Tragic
61.3%
Indonesians
0.3
/100
|
#259
Tragic
61.2%
Blackfeet
0.3
/100
|
#260
Tragic
61.1%

Japanese College, Under 1 year Correlation Summary

MeasurementJapanese DataCollege, Under 1 year Data
Minimum0.089%16.8%
Maximum55.6%83.7%
Range55.5%66.8%
Mean11.3%51.9%
Median7.1%53.4%
Interquartile 25% (IQ1)3.4%44.3%
Interquartile 75% (IQ3)14.7%60.8%
Interquartile Range (IQR)11.3%16.5%
Standard Deviation (Sample)12.1%14.1%
Standard Deviation (Population)12.0%13.9%

Correlation Details

Japanese PercentileSample SizeCollege, Under 1 year
[
0.0%
-
0.5%
]
0.089%
191,228,79865.8%
[
0.0%
-
0.5%
]
0.39%
32,064,61864.9%
[
0.5%
-
1.0%
]
0.68%
11,053,02562.6%
[
0.5%
-
1.0%
]
0.95%
5,586,56963.1%
[
1.0%
-
1.5%
]
1.23%
2,875,17760.5%
[
1.5%
-
2.0%
]
1.51%
1,549,68560.8%
[
1.5%
-
2.0%
]
1.77%
1,268,09860.8%
[
2.0%
-
2.5%
]
2.09%
537,39257.3%
[
2.0%
-
2.5%
]
2.37%
401,59655.8%
[
2.5%
-
3.0%
]
2.64%
83,84858.3%
[
2.5%
-
3.0%
]
2.93%
184,19254.1%
[
3.0%
-
3.5%
]
3.15%
208,25661.4%
[
3.0%
-
3.5%
]
3.43%
147,54548.2%
[
3.5%
-
4.0%
]
3.81%
638,20963.1%
[
4.0%
-
4.5%
]
4.08%
60,10751.0%
[
4.0%
-
4.5%
]
4.30%
473,88248.5%
[
4.5%
-
5.0%
]
4.57%
68,00854.2%
[
4.5%
-
5.0%
]
4.73%
74,69540.5%
[
5.0%
-
5.5%
]
5.21%
41,24055.0%
[
5.0%
-
5.5%
]
5.34%
5,60052.9%
[
5.5%
-
6.0%
]
5.64%
104,25149.6%
[
5.5%
-
6.0%
]
5.96%
70,81849.7%
[
6.5%
-
7.0%
]
6.54%
65,60853.8%
[
6.5%
-
7.0%
]
6.83%
27855.0%
[
6.5%
-
7.0%
]
6.99%
41,00155.0%
[
7.0%
-
7.5%
]
7.29%
64544.3%
[
7.5%
-
8.0%
]
7.63%
59,15342.2%
[
8.0%
-
8.5%
]
8.23%
4,14563.1%
[
8.5%
-
9.0%
]
8.84%
12,32477.0%
[
8.5%
-
9.0%
]
8.91%
11,67877.9%
[
9.0%
-
9.5%
]
9.38%
2,91179.3%
[
9.5%
-
10.0%
]
9.81%
59,46042.7%
[
10.5%
-
11.0%
]
10.92%
27,84857.7%
[
12.0%
-
12.5%
]
12.25%
2,58824.7%
[
12.5%
-
13.0%
]
12.88%
13283.7%
[
13.5%
-
14.0%
]
13.86%
114,73751.4%
[
14.0%
-
14.5%
]
14.08%
1,36435.3%
[
14.5%
-
15.0%
]
14.72%
2,21531.8%
[
15.0%
-
15.5%
]
15.03%
32635.5%
[
16.0%
-
16.5%
]
16.30%
41137.9%
[
16.0%
-
16.5%
]
16.47%
86852.2%
[
17.0%
-
17.5%
]
17.03%
7,11848.3%
[
20.5%
-
21.0%
]
20.70%
1,57530.2%
[
22.0%
-
22.5%
]
22.12%
5,47851.2%
[
23.0%
-
23.5%
]
23.24%
92120.7%
[
30.5%
-
31.0%
]
30.73%
32,32349.5%
[
36.5%
-
37.0%
]
36.86%
38859.7%
[
38.5%
-
39.0%
]
38.81%
21936.9%
[
46.5%
-
47.0%
]
46.82%
22016.8%
[
55.5%
-
56.0%
]
55.56%
944.4%